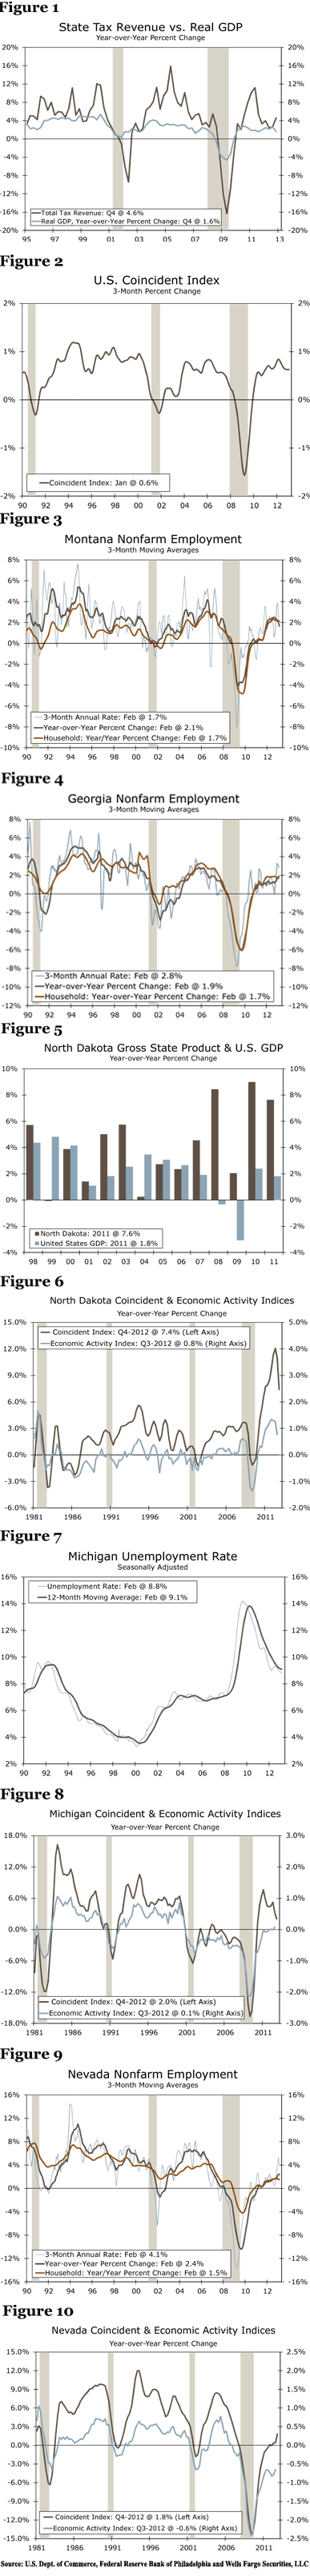
Looking ahead, economic activity is the most reliable indicator of state tax collections. Solidgrowth in a state’s economy typically means that municipalities should be able to generate enoughtax revenue to meet their obligations, absent structural impediments. The most effective andcomprehensive measure of state economic activity and sustainability of tax revenue is the U.S.Bureau of Economic Analysis’ calculation of real GDP by state. A simple regression shows that a1 percent rise in real GDP typically leads to a 2.3 percent increase in state tax revenue.
While real GDP is a critical state economic indicator, the data are compiled on an annual basisand lag a year. Moreover, data are often revised substantially from their initially reported level.That said, a more timely measure of state economic activity is the state coincident index, which iscompiled by the Federal Reserve Bank of Philadelphia. The state coincident index (SCI) isproduced on a monthly basis and combines four state-level indicators to summarize currenteconomic conditions, including nonfarm payroll employment, average hours worked inmanufacturing, the unemployment rate and wage and salary disbursements. However, the SCImay be somewhat misleading, as all four of its variables are heavily reliant on employmentindicators, which are subject to substantial revisions. In this report, we take an alternativeapproach to measuring state economic activity by using dynamic factor modeling. 1
The Employment Bias: Revisions Skew Preliminary Results
Since late 2010, employment growth in the United States has modestly improved, but the pace isstill sluggish compared to previous economic recoveries. Moreover, improvement across stateshas been uneven with growth models embedded in high tech, energy, autos and travel andtourism showing the largest gains. While SCI is a timely monthly indicator, it is heavily weightedtoward employment, which can give misleading preliminary results due to data revisions. In fact,the state of Georgia had a whopping revision of 2.3 percent in December 2011 and Montana alsohad a sizable revision of -2.0 percent. To help mitigate some of the volatility, we have introduceda new index as a proxy of state economic activity that includes 15 variables using dynamic factormodeling (DFM).
An Alternative Methodology: State Economic Activity Index
The State Economic Activity-Index (SEA-Index) contains a broader assortment of variables,which we believe is a better measure to gauge state economic activity. The methodology and dataset are consistent across all 50 states, which makes the SEA-Index easily comparable acrossstates. Moreover, while the SEA-Index is a coincident index, leading variables such as initialjobless claims, consumer credit, building permits, consumer price index, stock prices and theyield spread (10-year Treasury less fed funds rate) are included in the index and provide somepredicative power.
SEA-Index = α + β1 = Employment + β2 = Tax Revenue + β3 = FHFA Home Price + β4 = Wage &Salary + β5 = Labor Force + β6 = Food Stamps + β7 = Initial Claims + β8 = Personal Income + β9= Unemployment Rate + β10 = Consumer Credit + β11 = Building Permits+ β12 = CPI + β13 =S&P 500 Index + β14 = Yield Spread + β15 = Retail Sales + et
Econometric note: The original dynamic factor modeling (DFM) approach dates back to the 1970s(Sargent and Sims [1977]) 2 , but was modified further in the 1980s (Chamberlain and Rothschild[1983]) 3 and, during the 1990s, Stock and Watson (1999) 4 improved the original DFM by utilizingadvanced estimation techniques. The fundamental assumption of the DFM approach is that eacheconomic variable can be decomposed into a common factor component plus an idiosyncraticcomponent. We follow the Stock-Watson (1999) and the Chicago Fed approaches and extract thefirst principal component from the 15 variables of a state (12 state specific and three nationalvariables), and then the component is used as a representative of a state’s economic activity. Theprocess is repeated for each of the 50 states, which gives us 50 state economic activity indices.
Our Findings: State Economic Activity More Muted
We find that while many states continue to see improvement in economic activity, the pace ofgrowth is far more muted than reported by the SCI. Specifically, the SEA-Index suggestscontinued solid improvement in North Dakota, Oklahoma, Michigan, Wyoming, West Virginia,South Dakota, Texas and Montana (See Appendix). States with a growth structure that is drivenby energy and the recent improvement in autos have shown the largest gains. While most statesstill have a negative reading, it suggests economic activity is still not at its prerecession level.Moreover, states with the weakest economic activity have structures heavily weighted in hard hitsectors during the downturn. In an earlier paper, we found states with a heavy reliance on sectorshardest hit during the downturn, such as housing, manufacturing, tourism and construction,faced the most protracted recoveries. 5 As a result, sharp declines in household net worth andweakened credit hampered consumer spending weighed down tax revenue.
Key States Showing a Solid Recovery
North Dakota: Let the Good Times Roll
The North Dakota economy was relatively unscathed by the Great Recession. Boosted by energyexploration and a business friendly environment, real GDP in North Dakota grew more than fourtimes that of the nation at 7.6 percent in 2011. The state also boasts the lowest unemploymentrate in the country at 3.3 percent in February. The tight labor market has supported growth inwages and salaries, which are up 13.6 percent from a year ago. The state continues to be a magnetfor job seekers with population growth up 2.2 percent over the past year, far surpassing the nationat just 0.7 percent. Furthermore, North Dakota avoided the housing boom and subsequent bust,leaving room for continued building in the state; total housing permits increased 62 percent in2011 and FHFA home prices were up 8.1 percent in 2012. State fiscal conditions remain healthy astax revenues rose nearly 50 percent on a year-over-year basis in 2011 amid healthy gains incommodity prices and income. North Dakota is one of nation’s top oil producers. As a result, oildrilling and construction employment have risen at a double-digit pace since early 2010. Withactivity in the energy sector due mainly to new advances in technology rather than higher prices, the good times should continue to roll.
Michigan: Auto Manufacturing Aids the Wolverine State’s Economy
The state of Michigan has been racked with economic troubles over the past decade but has since made solid improvement. Led by gains in auto manufacturing, employment rose 1.8 percent in 2012. The housing market is also showing strong growth with building permits up 27 percent in 2012. Due to the downturn, the percentage of underwater borrowers remains exceptionally high, but the share is declining with improving economic conditions. In addition, wages and salaries and personal income have increased over the past year. The Michigan economy still has a long way to go before recovering from its decade-long slump, but the recent improvement in employment, housing and income suggest the state’s near-term outlook is finally improving.
The Outlier: Nevada Remains Weak
Nevada: Tourism Is Beginning to Improve, but Housing Is Still Languishing
Economic activity in Nevada is showing improvement but remains bleaker than anywhere else in the country. The housing boom and bust hit Nevada particularly hard, and the aftereffects are still looming. In Las Vegas, where the population swelled 37 percent between 2000 and 2009, house prices are now down 55.7 percent from peak to current. With the decline in prices, nearly six out of 10 homeowners owe more on their mortgage than their home is currently worth. Foreclosures remain near all-time highs, leaving a glut of homes on the market and further depressing home prices. Moreover, the state’s fiscal conditions do not offer much comfort. Falling home values have the potential to negatively affect property taxes, which account for approximately 30 percent of state revenues. Similarly, consumer spending has been limited by high unemployment and weak income growth, dragging down sales tax collections, which make up roughly 55 percent of state revenues. Tax revenues will remain weak until the housing market and employment situation improve. However, one silver lining is that residential investment activity has picked up in the state.
1 The initial draft of this report was presented at the 2013 Annual Meeting of the American Economic Association, Jan. 4-6, 2013 in San Diego. Academic paper available upon request.
2 Sargent T.J, and Sims CA. (1977). “Business cycle modeling without pretending to have too much a priori economic theory”, In New Methods in Business
3 Chamberlain, Gary, and M. Rothschild (1983). “Arbitrage, Factor Structure and Mean-Variance Analysis in Large Markets”. Econometrica 51: 1305-1324.
4 Stock, James H. and Mark W. Watson. (1999). Forecasting Inflation, Journal of Monetary Economics, Vol 44, No. 2 October, pp. 293-335.
5 Vitner, Khan, Iqbal and Watt, “The State of States: A Quantitative Approach”, March 22, 2011