Responding Consultants’ Profile
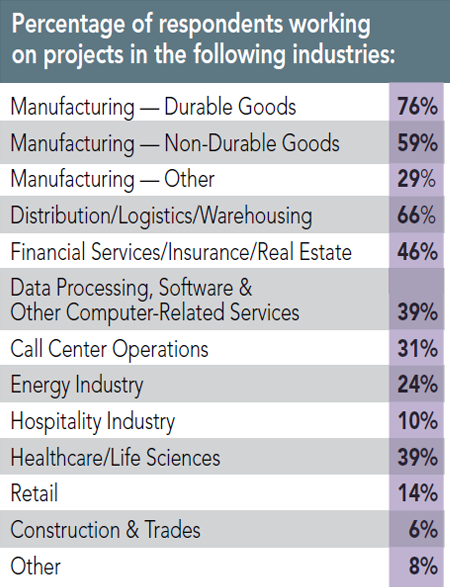
Three quarters of the responding consultants work with durable goods manufacturers, and nearly 60 percent with nondurable goods manufacturers. Two thirds are helping to site distribution/warehouse facilities, and nearly 40 percent are working on projects in the data processing/computer-related services and healthcare/life sciences sectors.
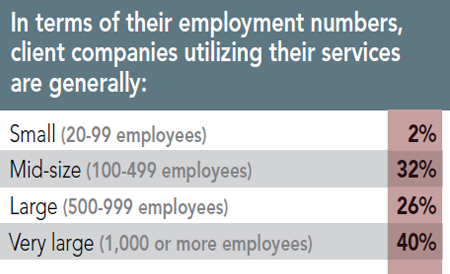
Additionally, the majority of their clients are very large in terms of employment numbers (1,000+), say 40 percent of the responding consultants. This stands in contrast to the respondents to our Corporate Survey wherein 79 percent of the respondents are with firms employing fewer than 1,000 people.
12th Annual Consultants Survey Results
-
Chart A

-
Chart B
-
Chart C
-
Chart D
-
Chart E
-
Chart F
-
Chart G
-
Chart H
-
Chart I
-
Chart J
-
Chart K
-
Chart L
-
Chart M
-
FChart N
-
Chart O
-
Chart P
-
Chart Q
-
Chart R
-
Chart S
-
Chart T
-
Chart U
-
Chart V
-
Chart W
-
Chart X
-
Chart Y
-
Chart Z
-
Chart AA
-
Chart BB
-
Chart CC
-
Chart DD
-
Chart EE
-
Chart FF
-
Chart GG
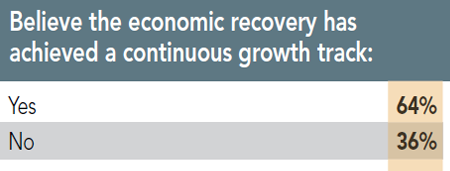

Finally, nearly two thirds of the responding consultants believe the economic recovery has achieved a continuous growth track. These consultants are more optimistic than the Corporate Survey respondents — only 48 percent of them hold that opinion. Needless to say, that is probably because the consultants are primarily working with companies that are in a growth mode.
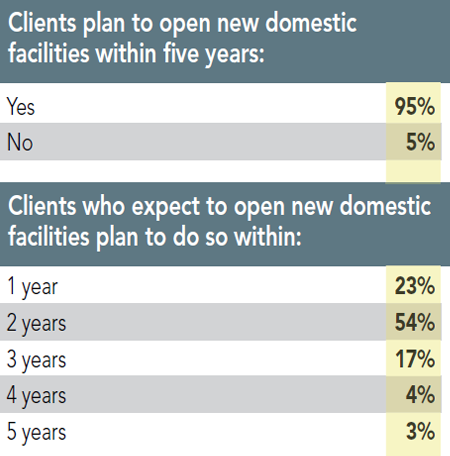
Clients’ New Facilities Plans
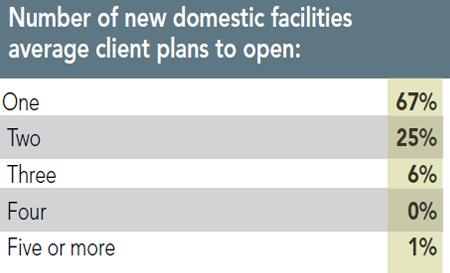
This reasoning is borne out by the fact that 95 percent of the responding consultants say their clients plan to open new domestic facilities within five years (only half of the Corporate Survey respondents have new facilities plans), with three quarters of the consultants saying those clients plan to do so within two years. Two thirds of the respondents say their clients will open just one new domestic facility, while a quarter say they will open two.

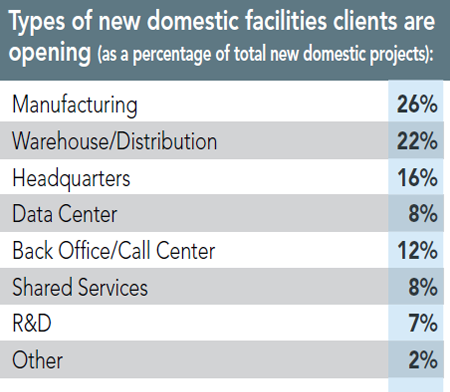
A quarter of these new facilities will be manufacturing plants, say the respondents, with about a fifth housing warehouse/distribution operations, 16 percent being new headquarters operations, and 12 percent back office/call centers. These last two facilities uses are not as heavily represented in the Corporate Survey responses.
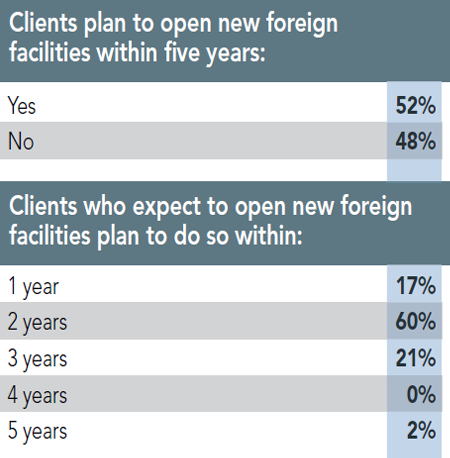
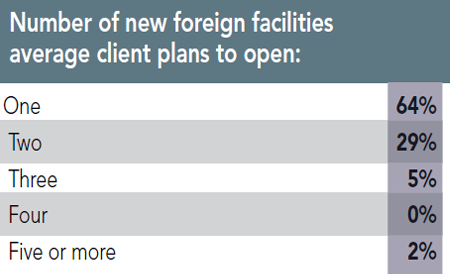
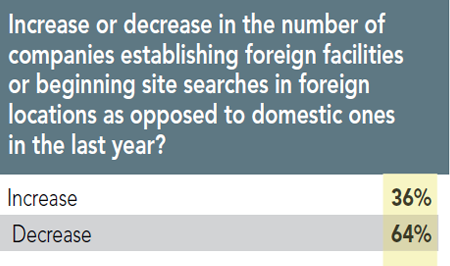
More than half of the respondents to our 12th Annual Consultants Survey also say their clients expect to open new foreign facilities within the next five years — only 25 percent of the Corporate Survey respondents say they have such plans. Three quarters of the consultants’ clients plan to open these foreign facilities within two years, with more than 90 percent having plans for one or two foreign facilities.
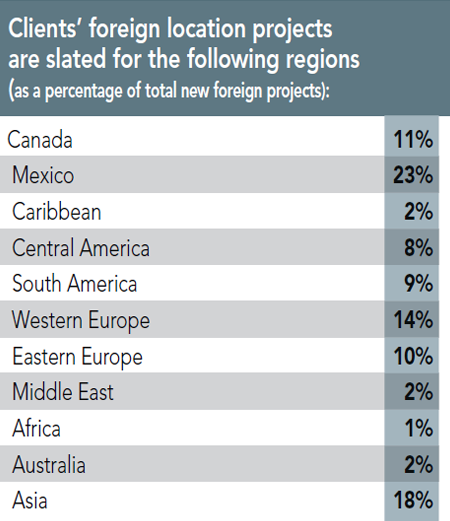
Nearly a quarter of these foreign facilities projects are slated for Mexico, 18 percent for Asia, 14 percent for Western Europe, and 11 percent for Canada. Notably, none of the respondents to our Corporate Survey report plans for new facilities in Canada.
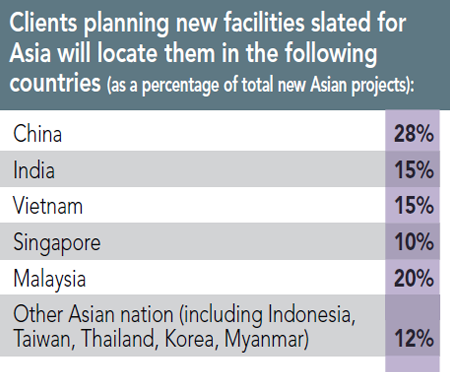
China will receive 28 percent of the consultants’ clients’ projects in Asia, but a fifth are also going to Malaysia, and 15 percent each to India and Vietnam. In contrast, the respondents to our 30th Annual Corporate Survey who have plans for Asian facilities say 71 percent of them will be in China.
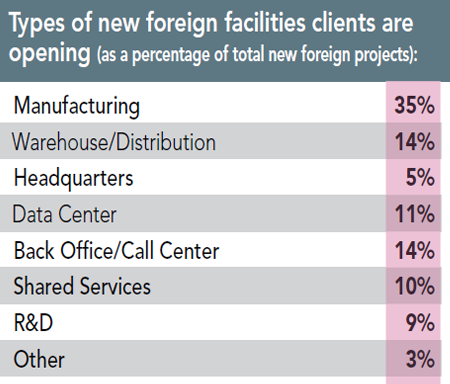
The types of foreign facilities the responding consultants’ clients are opening range from manufacturing facilities (35 percent) to warehouse/distribution and back office/call centers (each 14 percent) to shared services operations (10 percent). Only 5 percent of the Corporate Survey respondents’ new foreign facilities will house back office/call center as well as shared services operations.
Clients’ Relocation and Expansion Plans
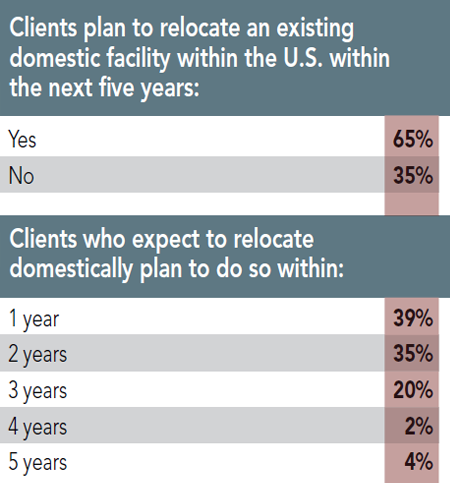
When it comes to their clients’ relocation plans, 65 percent of those responding to our Consultants Survey say their clients plan to relocate an existing domestic facility within the U.S. within the next five years.
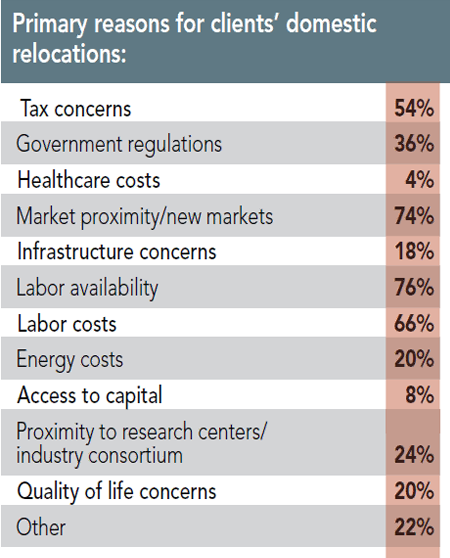
Of those consultants’ clients who plan to relocate domestically, three quarters of the respondents claim they will do so within a year or two. Three quarters of the respondents also say the primary reasons their clients are moving are market proximity/new markets and labor availability. Two thirds also cite labor costs, and half cite tax concerns among the reasons for these domestic relocations.
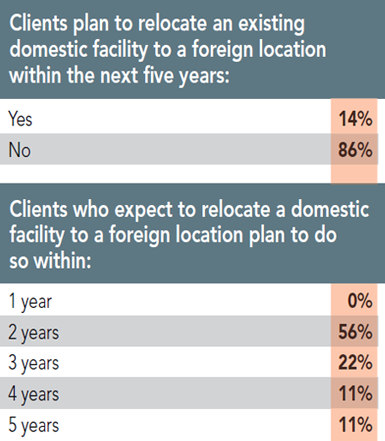
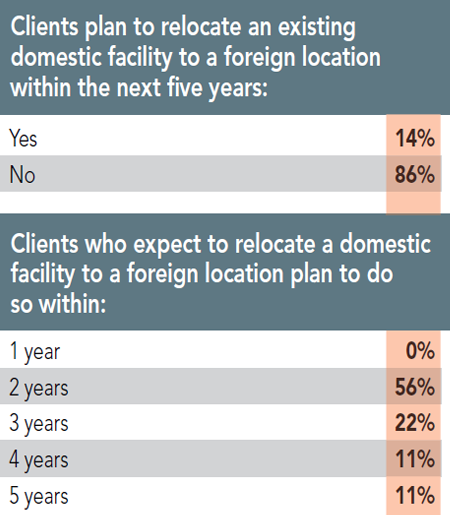
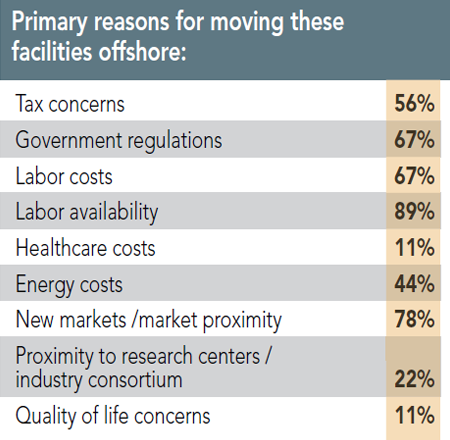
Of those clients that are planning to move a domestic facility offshore, half the responding consultants claim the moves are planned two years out. Nearly 90 percent cite labor availability as the reason for their clients going offshore; more than three quarters again cite market proximity/new markets; and two thirds say government regulations along with labor costs are prompting their clients to consider foreign locations.
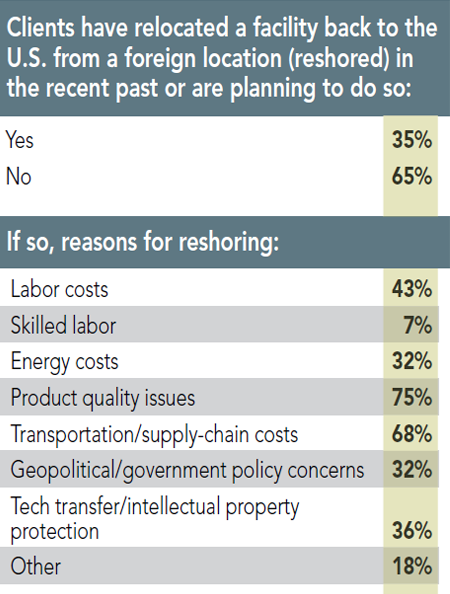
Similarly, two thirds of the respondents say their clients have not relocated a foreign facility back to the U.S. (reshored) in the past year, nor are they planning to do so. (Notably, 90 percent of our Corporate Survey respondents say they do not expect to reshore a facility.) Of those consultants’ clients that have reshored, three quarters of the consultants say their clients have done so because of product quality issues, and nearly 70 percent say transportation/supply chain costs are to blame for their clients’ reshoring moves.
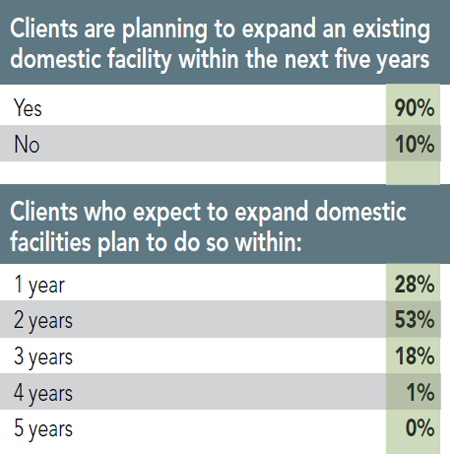
Nearly all of the respondents (90 percent) to our 12th Annual Consultants Survey say their clients are planning to expand an existing domestic facility within the next five years, with more than 80 percent expecting to do so within two years.
Next: Clients’ Site Selection Priorities
{{RELATEDLINKS}}Clients’ Site Selection Priorities
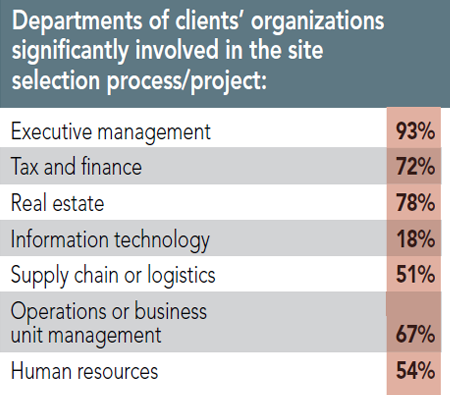
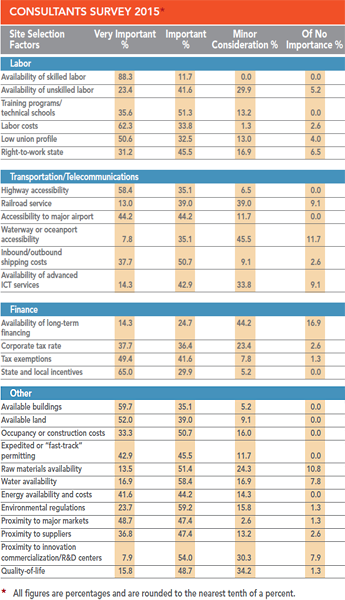
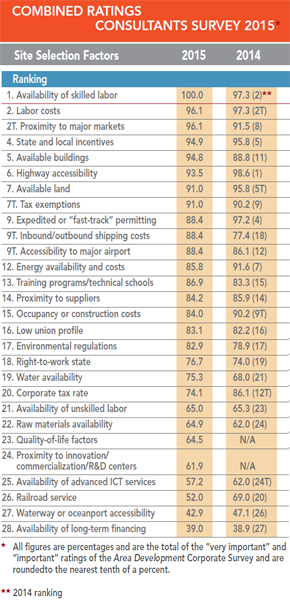
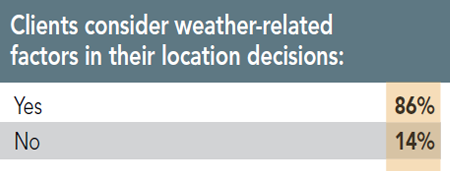
We’ve also asked the consultants to rate the site selection factors on which their clients base their location and expansion decisions as “very important,” “somewhat important,” “minor consideration,” or “of no importance.” Although the site selection priorities of our Corporate Survey respondents (only 43 percent of whom use outside consultants when site selecting) and the Consultants Survey respondents diverge at many points, both groups highlight availability of skilled labor as the number-one factor.
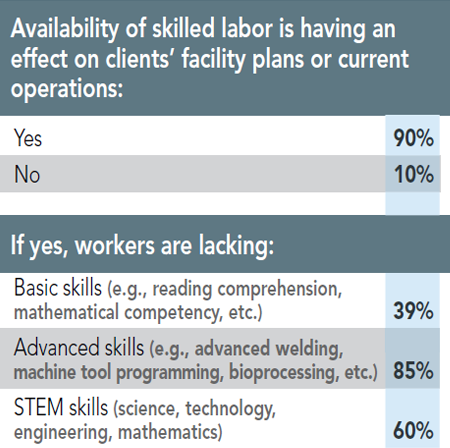
In fact, 100 percent of the responding consultants rated this factor as “very important” or “important.” Ninety percent of these consultants say availability of skilled labor is having an effect on their clients’ facility plans or current operations, with 85 percent saying workers are lacking advanced skills like machine tool programming or bioprocessing; 60 percent note that workers lack the increasingly important STEM skills as well.
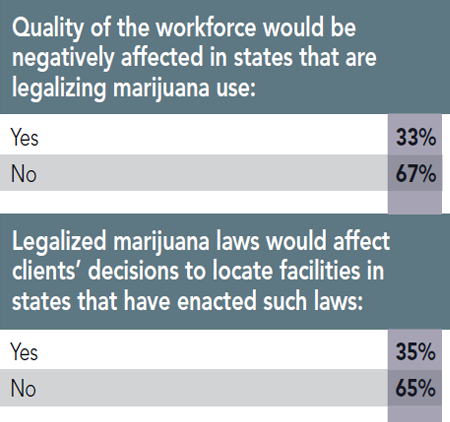
Interestingly, the responding consultants are not as concerned about the effect on the workforce of legalizing marijuana: two thirds say it will have no effect on workforce quality, nor do they feel legalized marijuana laws would affect their clients’ decisions to locate facilities in states that have enacted such laws. In contrast, more than half of the Corporate Survey respondents say marijuana legalization would affect workforce quality, with nearly 50 percent saying it would also have a bearing on their location decisions — obviously there’s a disconnect here!
12th Annual Consultants Survey Results
-
Chart A
-
Chart B
-
Chart C
-
Chart D
-
Chart E
-
Chart F
-
Chart G
-
Chart H
-
Chart I
-
Chart J
-
Chart K
-
Chart L
-
Chart M
-
FChart N
-
Chart O
-
Chart P
-
Chart Q
-
Chart R
-
Chart S
-
Chart T
-
Chart U
-
Chart V
-
Chart W
-
Chart X
-
Chart Y
-
Chart Z
-
Chart AA
-
Chart BB
-
Chart CC
-
Chart DD
-
Chart EE
-
Chart FF
-
Chart GG
For example, although highway accessibility is ranked sixth by the consultants, this factor has a 93.5 percent combined importance rating. And a related factor, proximity to major markets, is tied in the rankings for the number-two spot with labor costs, with both of these site selection factors considered “very important” or “important” by 96.1 percent of the responding consultants. Another cost factor — inbound/outbound shipping costs — is ranked ninth (tie) with an 88.4 percent combined importance rating, representing the largest increase in the combined importance ratings with a jump of 11 percentage points over the prior year’s Consultants Survey.
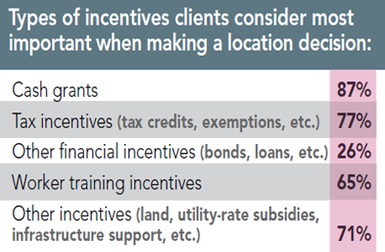
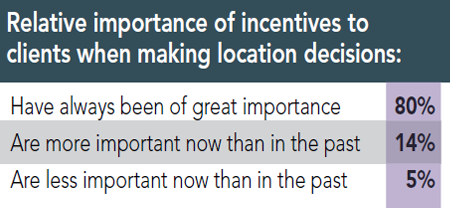
Since incentives negotiation/management is one of the primary services the consultants are providing to their clients, it stands to reason that state and local incentives is ranked fourth among the factors, receiving a 94.9 percent combined importance rating from the respondents to our 12th Annual Consultants Survey. Eighty percent of the respondents say incentives have always been of great importance to their clients when making location decisions. Nearly 90 percent say their clients actually consider cash grants most important, with more than three quarters saying tax incentives are most important. Two thirds note the importance of training incentives as well.
The related factor of tax exemptions is ranked seventh with a 91 percent combined rating. Surprisingly, corporate tax rate only ranks 20th, slipping 12 percentage points from the prior year’s Consultants Survey (the second-largest decrease in the combined importance ratings) and now considered “very important” or “important” by only 74.1 percent of the respondents. The explanation for this might be contained in a recent article in Area Development (Directory 2016) from Hartley Powell and David Padykula at KPMG: “Why Location Matters to Manufacturers in Lessening the Tax Bite.” The authors say, “Statutory tax rates only tell part of the story. While topline rates are important, and high rates may provide “sticker shock” for companies considering locating within a given state, they are just one component of an enterprise’s effective tax burden. Tax incentives, apportionment, throwback rules, and other factors often have a dramatic effect on effective tax burdens. In some cases, states with low statutory tax rates often impose high effective tax burdens, and vice versa.”
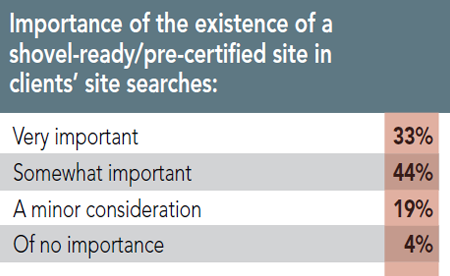
Available buildings and available land also land among the top-10 site selection factors in the Consultants Survey, ranking fifth and seventh (tie), respectively, with combined importance ratings of more than 90 percent. Available buildings are the clients’ choice for getting projects up and running quickly, and available land is needed for many of the larger, build-to-suit projects consultants are working on. Remember, two thirds of the responding consultants are working on projects for facilities with more than 500 employees. More than three quarters of the responding consultants also say the existence of a shovel-ready or pre-certified site is very or somewhat important in their clients’ site searches. Closely related to this is expedited or “fast-track” permitting in a tie for the ninth spot with an 88.4 percent combined importance rating.
The factor showing the largest drop in its combined importance rating (17 percentage points) is railroad service, now rated “very important” or “important” by slightly more than half of the responding consultants. This seems to be an anomaly because although trucks are the primary conveyance for domestic freight, all signs point to the increased importance of rail as part of the logistics picture. Just last year, the Federal Railroad Administration projected the tonnage of freight shipped by the U.S. rail system would increase 22 percent by 2035. Products being shipped into and out of the U.S. at the nation’s ports are arriving and leaving by rail — a key link in the nation’s intermodal system. Are falling fuel prices having an effect on the preference to ship by rail? Analysts say that if rail loses some of its cost advantages over trucking, companies may switch back to take advantage of trucking’s faster speed and greater convenience over rail. This new conundrum might be reflected in the drop in the consultants’ rating of railroad service.
Just as water availability showed the second-largest increase in importance among our Corporate Survey respondents, it also showed the second-largest increase among our Consultants Survey respondents — this time increasing 7.3 percentage points, and now considered “very important” or “important” by more than three quarters of the consultants. Again, as problems with water availability as well as quality take center stage across the nation, we can only expect this factor to keep rising in importance.
Consultants’ Information Sources
Nearly all (93 percent) of the respondents to our 12th Annual Consultants Survey say they use site and facility planning magazines like Area Development for site selection information, while three quarters also use general business publications. When searching for information online, 90 percent of the respondents look at specific economic development organizations’ websites and they’re looking for economic data on specific locations. Interestingly, more than 70 percent say they don’t use social media for site and facility planning. Additionally, more than half of the responding consultants say their firms maintain their own site selection databases.
More than 85 percent of the respondents to our Consultants Survey say their clients generally put between one and five economic development organizations on their “short list,” with three quarters saying their clients make up to five site visits. Once their services are engaged, 46 percent of the consultants say their clients generally reach a location decision within six months to a year.