Year-end news on the manufacturing front was also very encouraging. The Institute for Supply Management’s PMI ™ (Purchasing Managers Index) registered 57 percent in December 2013, the second highest reading of the year. Of 18 manufacturing industries tracked by the ISM, 13 reported growth in 2013’s final month. And December’s manufacturing Employment Index of 56.9 was the highest since June 2011.
The Labor Department reported that December 2013 overall job gains of 74,000 were less than previously expected. Commenting on the report, Capital Economics Chief U.S. Economist Paul Ashworth noted that he suspects the weakness was due in part to unseasonably harsh weather in December. However, unemployment reached a five-year low of 6.7 percent.
In order to find out if the corporate executives who read Area Development magazine also have more confidence in the U.S. economy, we asked them about their location and expansion plans and site selection priorities for the year ahead. Our survey was conducted in the fall of 2013. By the time we went to press on this issue in February 2014, continued severe winter weather was having a dampening effect on the economy. Nevertheless, these are the results of our Corporate Survey as recorded in Q4 2013.
The Corporate Survey Respondents
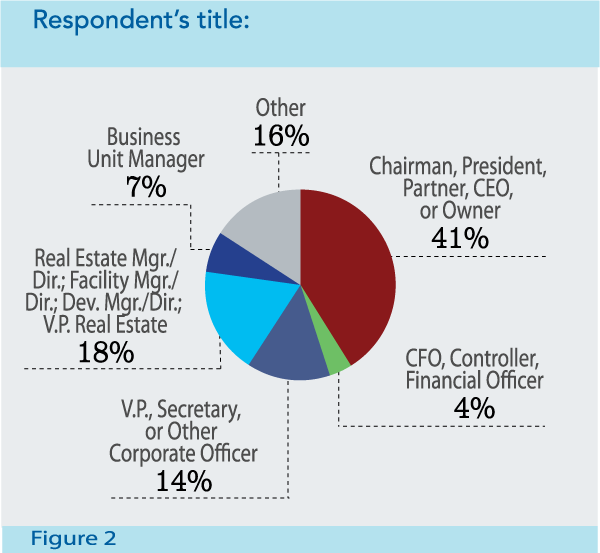
All told, 240 individuals responded to our 28th annual Corporate Survey. Of those, the majority (39 percent) are with manufacturing companies, and about a fifth represent the financial services/insurance/real estate sector (Slideshow, Figure 1). More than 40 percent are also the owners or chief executives of their firms, and 18 percent manage their companies’ real estate assets (Slideshow, Figure 2).
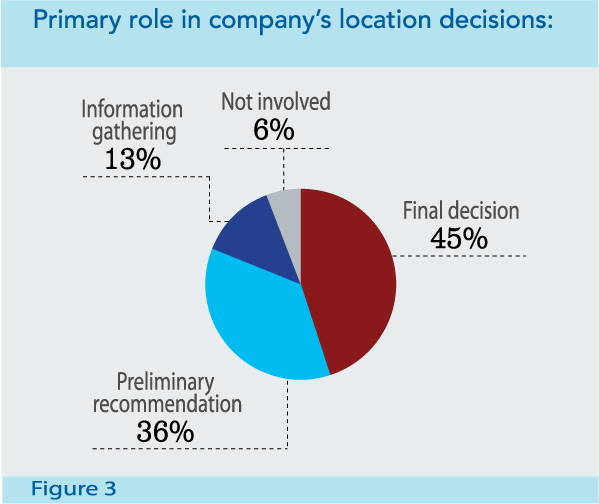
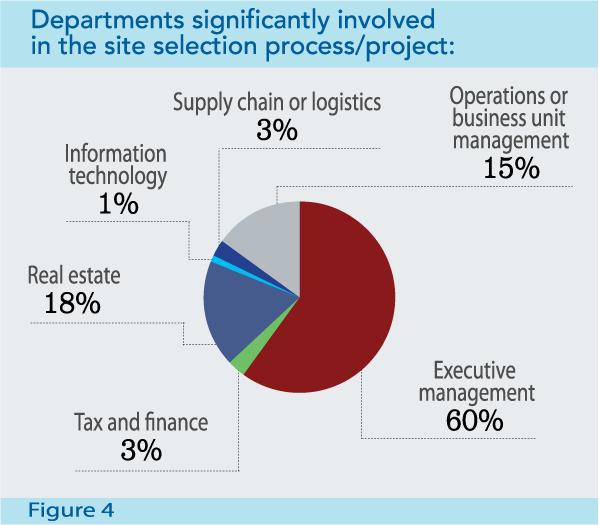
It follows that 45 percent of the respondents make their firms’ final location decisions, while 36 percent give a preliminary recommendation (Slideshow, Figure 3). Sixty percent claim that the primary player in their companies’ location decisions is executive management, but 18 percent say their companies’ real estate departments are significantly involved (Slideshow, Figure 4). The results of the Corporate Survey do show a modest improvement in short-range new facility and expansion plans
Interestingly, the same percentage say their firms operate just one domestic facility as five or more domestic facilities — 37 percent in each case. When it comes to foreign facilities, 39 percent of the respondents say they operate just one, while 43 percent indicate their companies operate five or more (Slideshow, Figure 5).
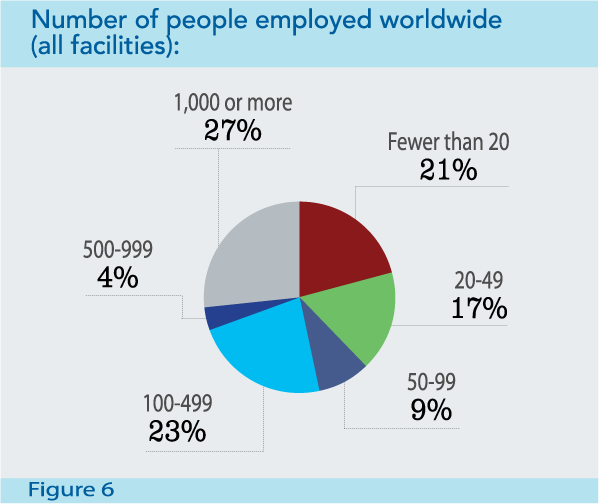
Nearly half of the respondents (47 percent) report their companies employ fewer than 100 people, but nearly a third (31 percent) employ 500 or more workers (Slideshow, Figure 6).
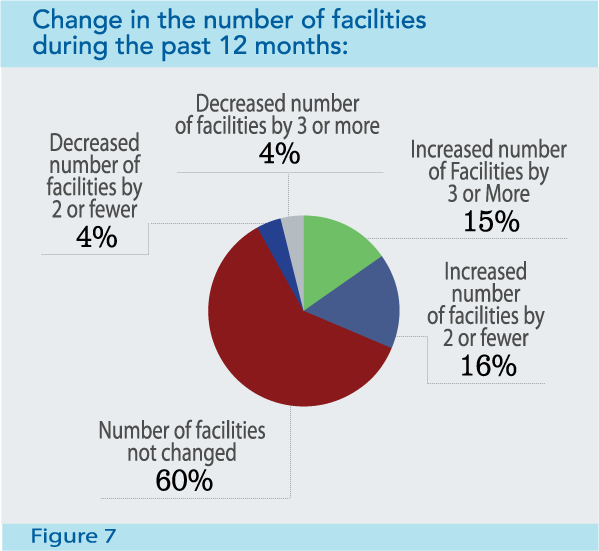
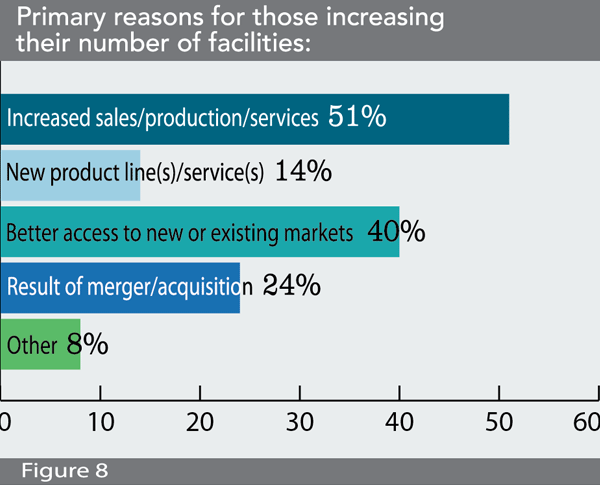
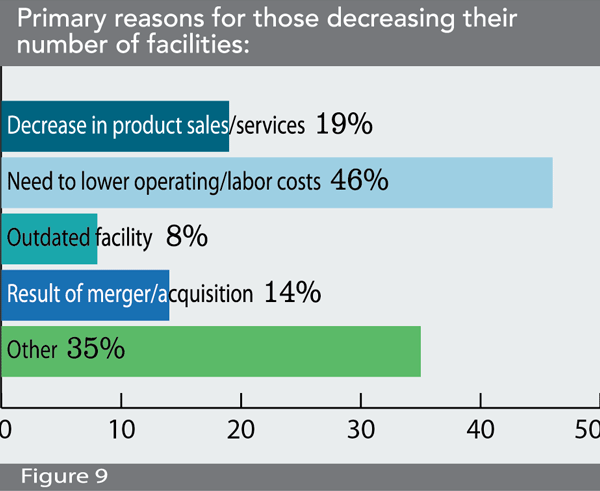
The majority (60 percent) experienced no change in the number of their companies’ facilities over the 12-month period prior to the survey. However, 31 percent did increase their number of facilities (Slideshow, Figure 7) — up from 29 percent who made that claim when taking the 27th annual Corporate Survey. More than half say this was in response to increased sales/production, and 40 percent say new facilities were added to give their companies better access to new or existing markets (Slideshow, Figure 8). Of the just 8 percent of the respondents who claim to have decreased their number of facilities over the past 12 months, nearly half (46 percent) report they did so in order to lower operating and/or labor costs (Slideshow, Figure 9).
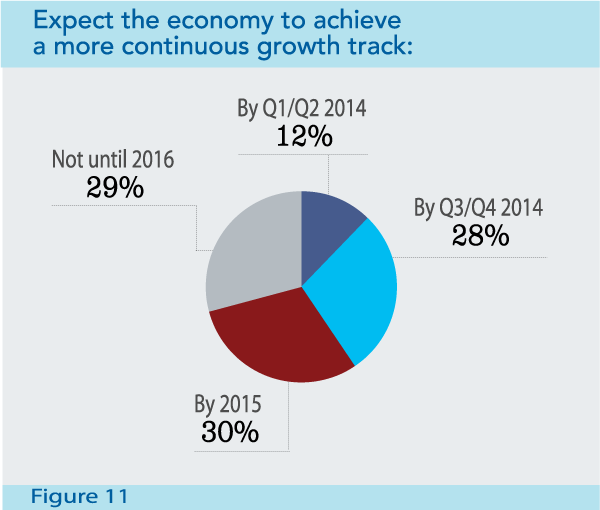
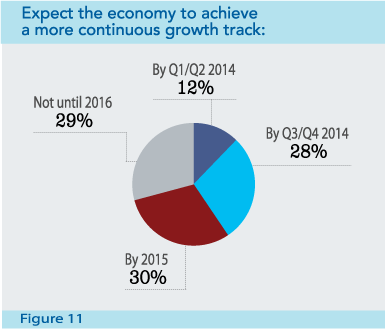
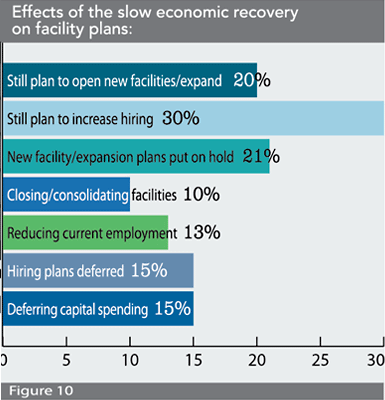
On another positive note, when asked about the effect of the slow economic recovery on their facility plans, 20 percent of the respondents to our 28th annual Corporate Survey say they still plan to open new facilities and 30 percent say they will increase hiring (Slideshow, Figure 10) — up from 20 percent who made that claim in response to the same question in 2012. Only 10 percent say the slow recovery would cause their companies to close or consolidate facilities — down from 15 percent in 2012. In fact, 40 percent of the respondents expect the economy to achieve a more continuous growth track this year (Slideshow, Figure 11). In 2012, 56 percent of the corporate respondents were projecting the economy would not improve for at least one to two years.
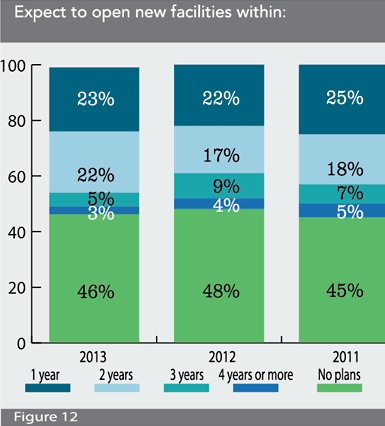
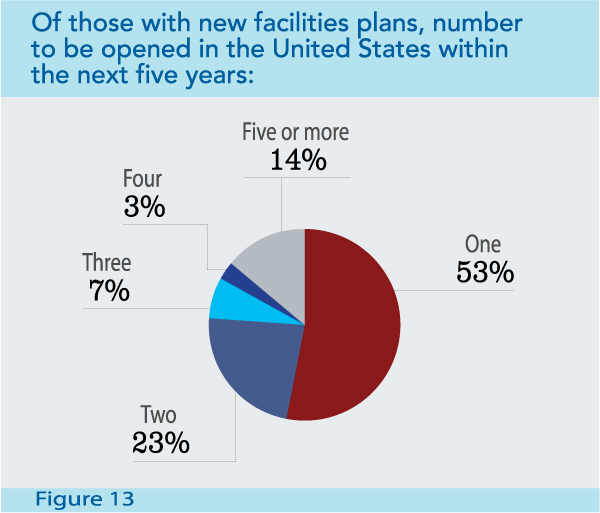
When asked specifically about their timeline for opening new facilities, 45 percent of the respondents say they expect to open new facilities within a year or two (Slideshow, Figure 12) — up from 39 percent who had short-range new facility plans in 2012. However, when it comes to the number of new U.S. facilities to be opened, this year’s Corporate Survey respondents are proceeding more cautiously: More than half expect to open just one new domestic facility, about a quarter will open two, and another 24 percent will open between three and five or more (Slideshow, Figure 13). In 2012, 39 percent of the respondents expected to open just one domestic facility and 35 percent had plans for three to five or more.
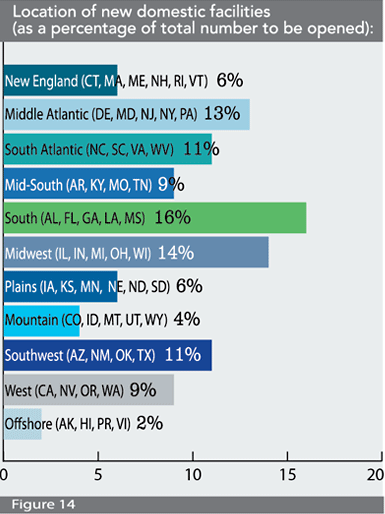
The overall locations slated for new U.S. facilities, however, have not changed significantly. Once again the South (Alabama, Florida, Georgia, Louisiana, Mississippi) is the regional favorite, projected to garner 16 percent of the new domestic facilities, followed by the Midwest (Illinois, Indiana, Michigan, Ohio, Wisconsin) at 14 percent (Slideshow, Figure 14). There is a slight uptick in projects planned for the Mid-Atlantic region (Delaware, Maryland, New Jersey, New York, Pennsylvania) — 13 percent of the domestic new facility projects will go there, followed by the South Atlantic (North Carolina, South Carolina, Virginia, West Virginia) and the Southwest (Arizona, New Mexico, Oklahoma, Texas), with each region expected to garner 11 percent of the total projects.
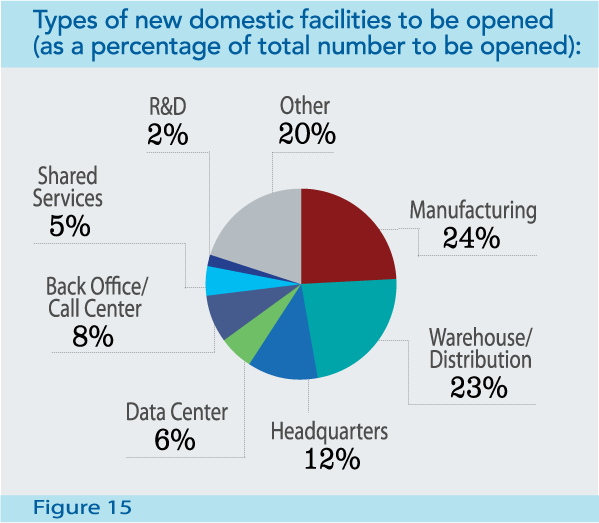
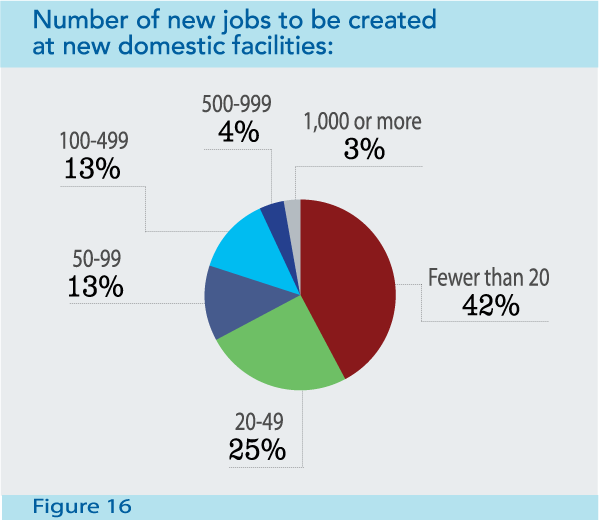
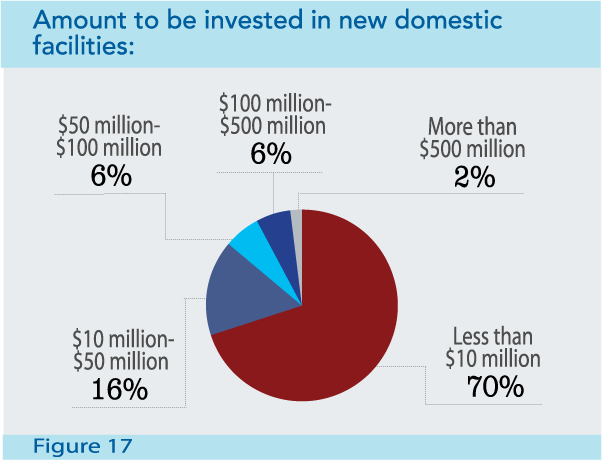
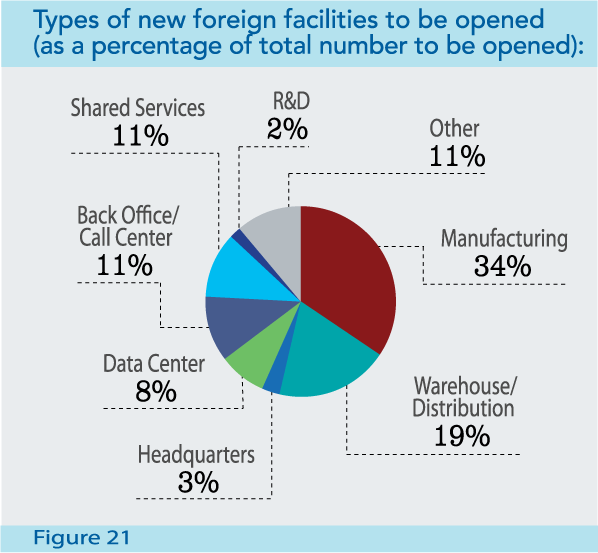
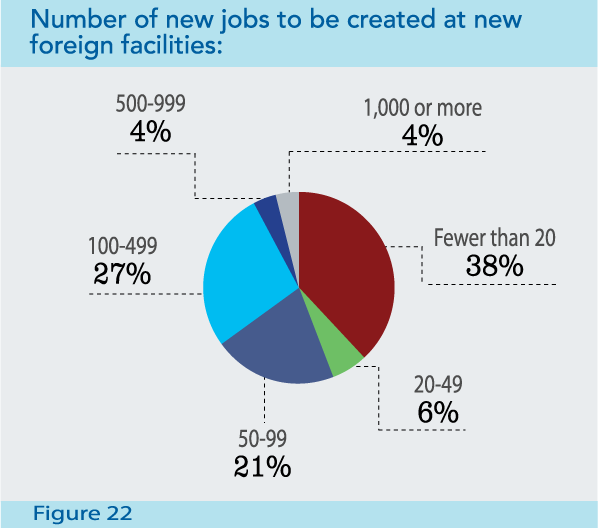
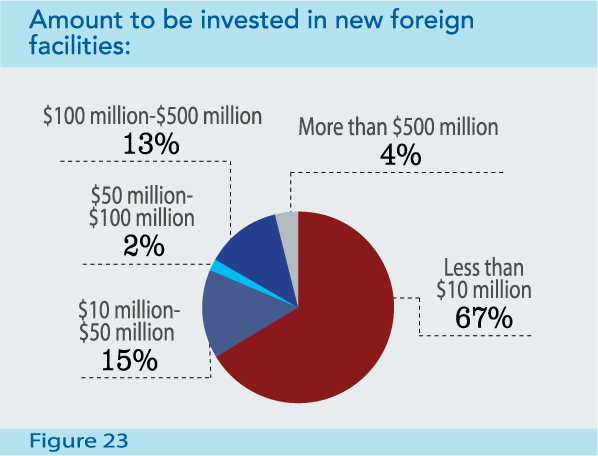
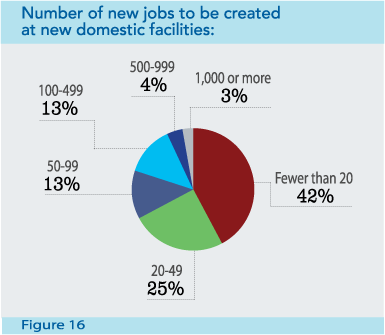
Manufacturing and warehouse/distribution facilities represent about a quarter each of the new domestic projects (Slideshow, Figure 15). Nevertheless, two thirds of the Corporate Survey respondents say these facilities will be small in terms of their employment numbers with fewer than 50 workers (Slideshow, Figure 16), and fully 70 percent say they will represent an investment of less than $10 million (Slideshow, Figure 17).
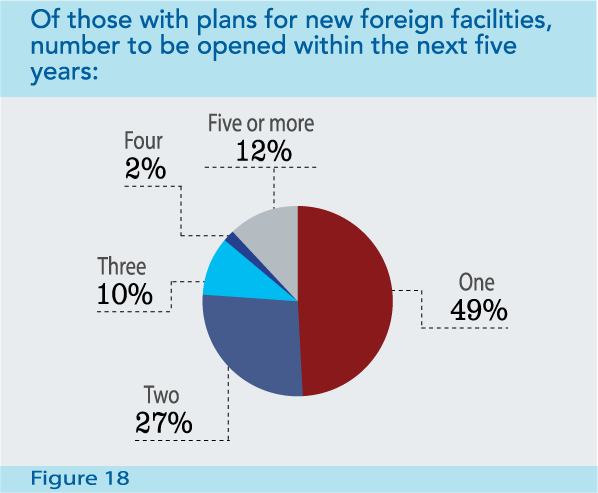
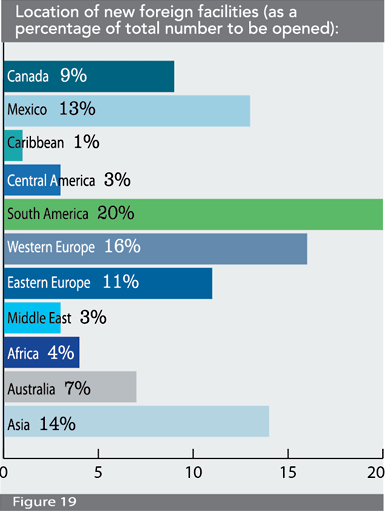
About half of the respondents to the 28th annual Corporate Survey also plan to open just one new foreign facility, while another quarter plan to open two (Slideshow, Figure 18). There has been an interesting change in where the responding corporate executives will place these new foreign facilities. One fifth of the new foreign facilities are slated for South America and 16 percent for Western Europe (Slideshow, Figure 19) — up from 12 percent for each region as planned by 2012’s Corporate Survey respondents.
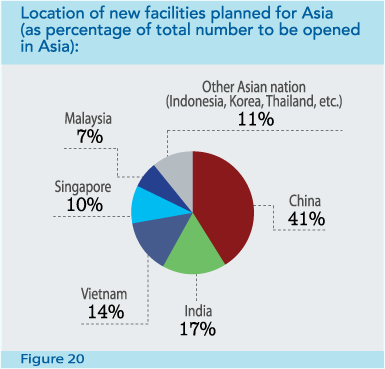
Importantly, plans for Asia have been halved — just 14 percent of the new foreign facilities are currently planned for this region by the survey respondents, down from 28 percent planned for Asia by 2012’s respondents to our Corporate Survey. Specifically, China will garner 41 percent of the new facilities planned for Asia (Slideshow, Figure 20) — down from 64 percent projected to go to that nation by 2012’s Corporate Survey respondents. This is no surprise considering the fact of China’s rising labor costs, which have made other Asian destinations more desirable. Case in point: New facilities planned for Vietnam comprise 14 percent of total Asian facilities planned by this year’s survey respondents, up from just 5 percent in 2012. Plans for new facilities in India remain steady at 17 percent of the total.
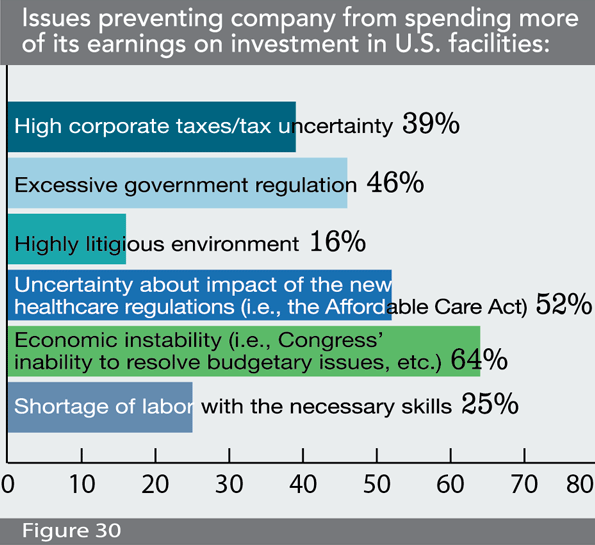
What is preventing the respondents’ firms from investing more money in U.S. facilities? Nearly two-thirds cite the United States’ economic instability, i.e., inability to resolve budgetary issues; more than half are concerned about the impact of new healthcare regulations (Affordable Care Act) on their businesses; and 46 percent blame their lack of spending on excessive government regulation (Slideshow, Figure 30). In fact, these concerns were also cited in the Q4 2013 National Association of Manufacturers (NAM)/IndustryWeek Survey of Manufacturers: 77.2 percent of those respondents cited rising healthcare/insurance costs as a current business challenge; and 76.1 percent cited unfavorable business climate, including taxes, regulations, and government uncertainties.
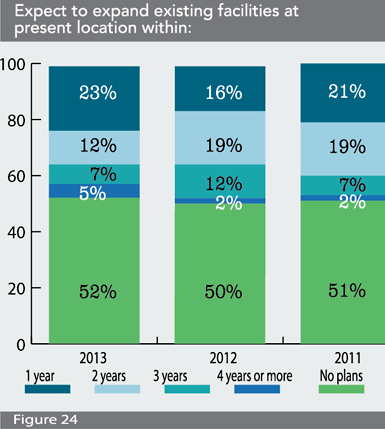
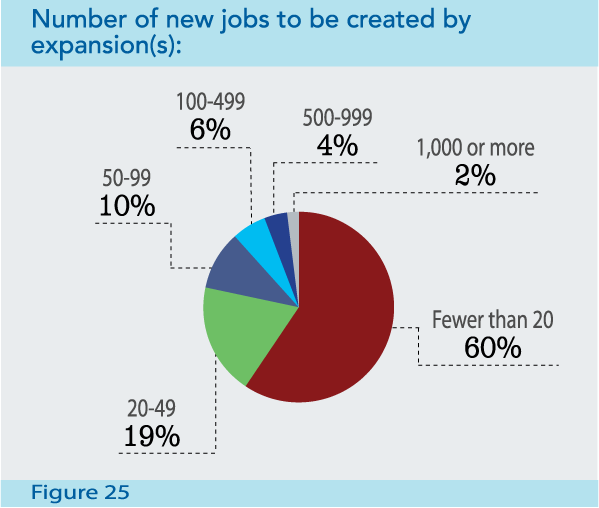
The short-term expansion plans of the respondents to our 28th annual Corporate Survey are more robust than the expansion plans of 2012’s survey respondents — 23 percent say they will expand a facility at their present location within one year (Slideshow, Figure 24). In 2012, only 16 percent of the corporate respondents said they had one-year expansion plans. However, expansion plans two to three years out are down from 31 percent in 2012 to just 19 percent for 2013’s respondents. Additionally, 60 percent say their expansions will create fewer than 20 jobs (Slideshow, Figure 25), while only 49 percent made that claim in 2012.
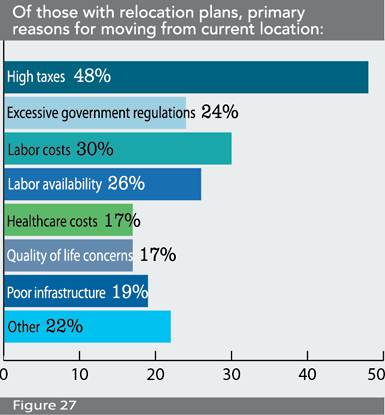
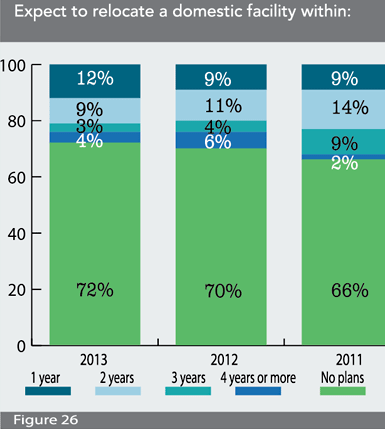
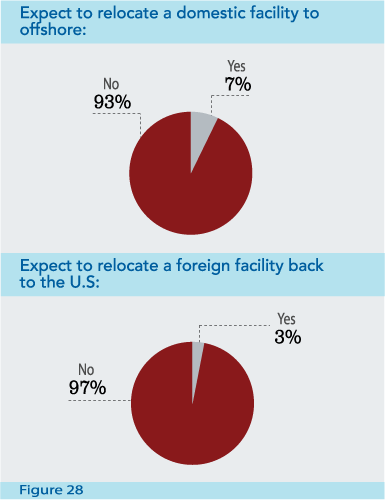
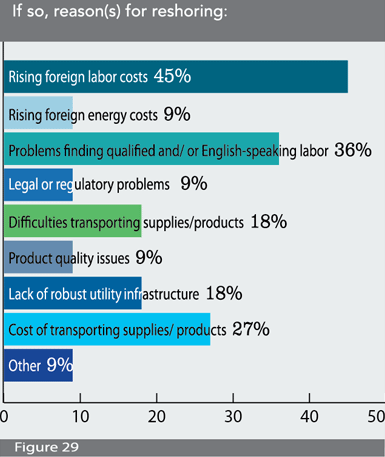
Nevertheless, only 7 percent expect to relocate a domestic facility offshore. And, although the news is full of reports of U.S. manufacturers re-shoring operations, just 3 percent of this year’s Corporate Survey respondents claim they will actually locate a foreign operation back to the United States (Slideshow, Figure 28). An interesting op-ed piece in The New York Times (1/25/14) speaks to the fact that this re-shoring trend creating a manufacturing “renaissance” represents only a trickle of jobs coming back to the U.S. In response to our survey, the small percentage re-shoring cite rising foreign labor costs, problems finding qualified and/or English-speaking labor, and costs of transporting supplies/products as their primary reasons for doing so (Slideshow, Figure 29).
Next: Factors in the Location Decision
{{RELATEDLINKS}}Factors in the Location Decision
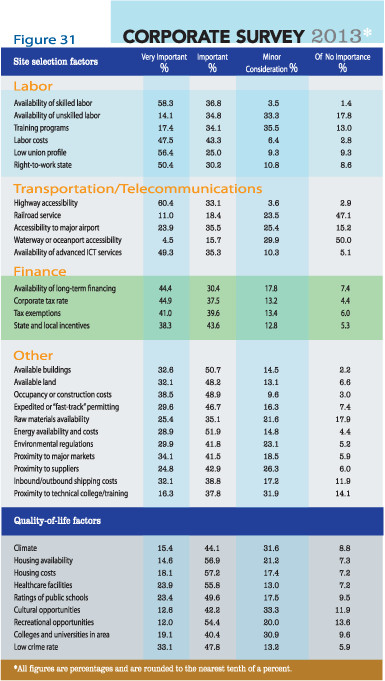
When planning for new facilities, expansion, and/or relocation, those charged with making the decisions take numerous site selection and quality-of-life factors into consideration. As in years past, we asked the Corporate Survey takers to rate these factors as either “very important,” “important,” “minor consideration,” or “of no importance.” The ratings in terms of percentages are shown in Figure 31. We then add the “very important” and “important” ratings so that we can rank the factors in order of importance, as shown in Figure 32. The quality-of-life factors are ranked separately from the site selection factors.
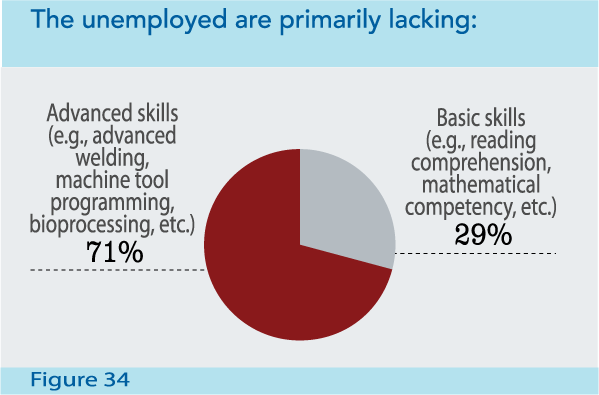
Historically, highway accessibility and labor costs have ranked as the top factors in our Corporate Survey respondents’ location decisions. However, this year, those factors were outranked by availability of skilled labor, which is considered “very important” or “important” by 95.1 percent of the respondents and is in 1st position. Manufacturers’ and other firms’ need for skilled labor is becoming increasingly pronounced and has been well documented. An aging worker demographic, along with a lack of interest in manufacturing careers among young people, has put the issue at the top of site selectors’ priorities. A new study from ThomasNet.com says this is “a ticking biological clock” for the manufacturing sector.

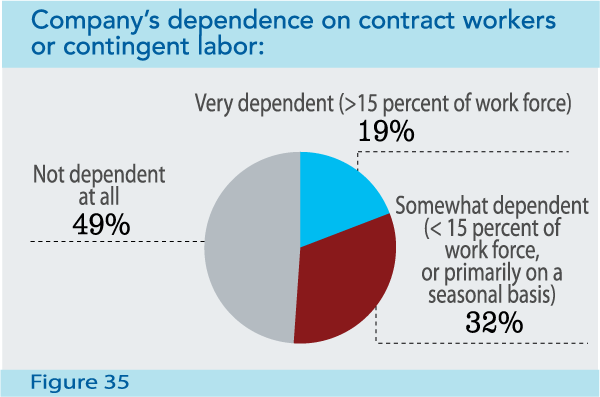
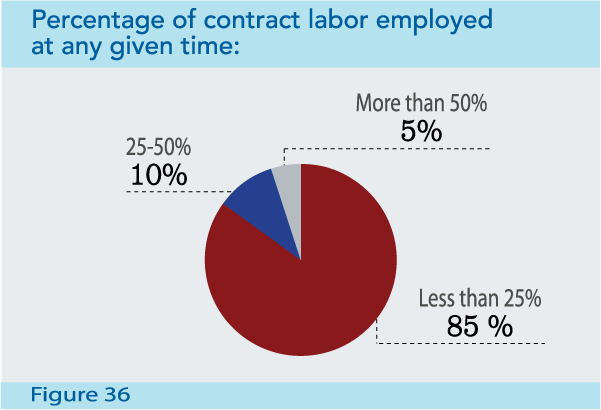
Additionally, half of the Corporate Survey respondents say they are very or somewhat dependent on contract workers, though most (85 percent) say contract labor accounts for less than 25 percent of their work force (Slideshow, Figures 35 and 36).
Of course, highway accessibility and labor costs are still paramount in the location decision; these factors are ranked 2nd and 3rd, respectively, considered “very important” or “important” by 93.5 percent and 90.8 percent of the survey respondents. The nation’s aging infrastructure is, in fact, on everyone’s mind. Bipartisan legislation was just introduced in Congress by Senator Roy Blunt (R-MO) and Senator Michael Bennet (D-CO) to establish a $50 billion American Infrastructure Fund to promote infrastructure improvements and create jobs as part of the Partnership to Build America Act. Nearly half the Corporate Survey respondents say they consider weather-related factors in the location decision
And labor costs are always a primary factor in location decisions. According to PricewaterhouseCoopers, by 2016, U.S. manufacturing hourly wages are forecast to be $35.61. And although labor costs in China are rising faster than those in the United States, for labor-intensive manufacturing industries, the cost differential in absolute terms is not likely to result in re-shoring, says Robert McCutcheon, PwC Partner and U.S. Industrial Products Sector Leader. He adds that manufacturers of products that are costly to transport, such as heavy metals and industrial machinery, might consider reshoring to lower their transportation and energy costs and might, in fact, be looking at states where right-to-work laws have kept hourly wages relatively low.
The right-to-work state factor was, in fact, tied for 11th place in the rankings this year, considered “very important” or “important” by 80.6 percent of the Corporate Survey respondents. Two states in the heavily unionized Midwest, Michigan and Indiana, have recently pass right-to-work legislation in an effort to compete for industry investment and jobs.
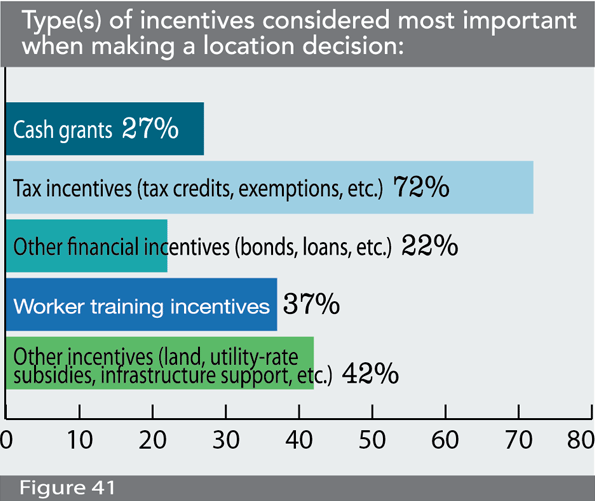
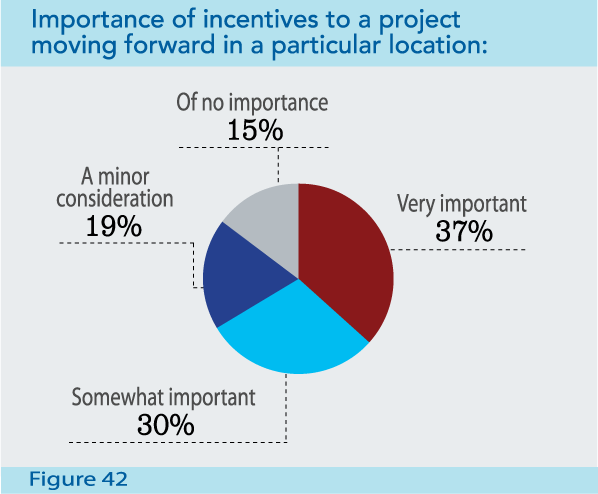
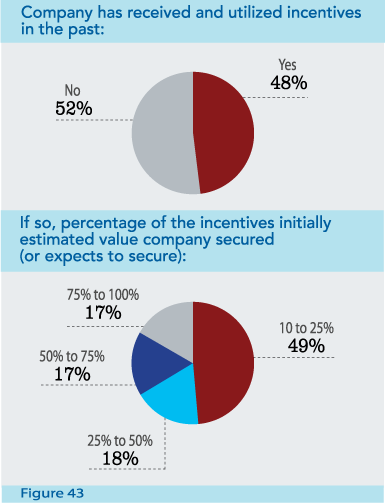
Among the top-10 site selection factors, one of two showing a five-position jump in the rankings is state and local incentives; this factor went from 13th in 2012 to 8th place in 2013’s Corporate Survey rankings, increasing 10.8 percentage points and now considered “very important” or “important” by 81.9 percent of the respondents. When primary considerations of labor and accessibility are satisfied, corporate executives look to incentives to keep costs in check.

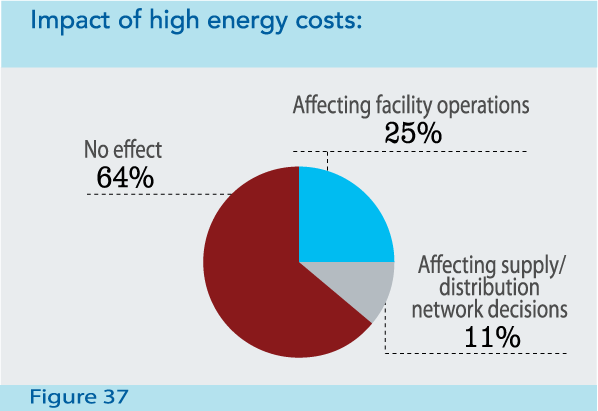
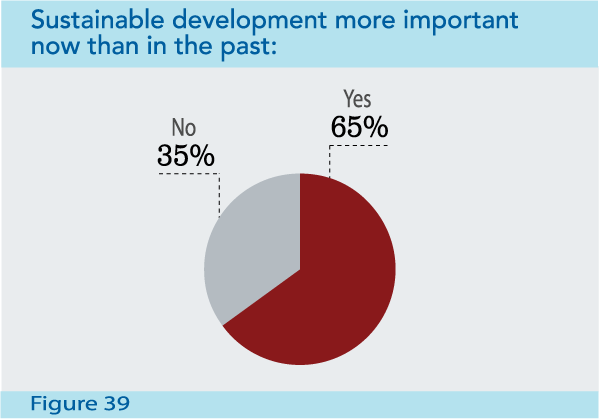
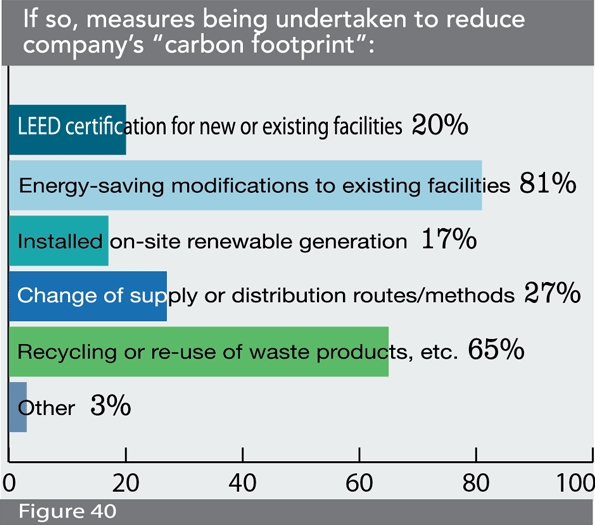
It should be noted that energy availability and costs dropped from 6th to 10th position in the rankings, although this factor is still considered “very important” or “important” by more than 80 percent of the Corporate Survey respondents. When asked separately about the impact of energy costs on operations or distribution networks, surprisingly, about two thirds of the respondents say these costs are having no effect (Slideshow, Figure 37). The declining cost of U.S. energy appears to be having a noticeable and positive influence. In fact, half of our survey respondents say new unconventional sources of energy, i.e., shale-derived natural gas through fracking, will continue to drive down the cost of energy. However, 80 percent say this will not impact their location decisions (Slideshow, Figure 38) and they are continuing to make energy-saving modifications to existing facilities (Slideshow, Figure 40). This year, the highway accessibility and labor costs factors were outranked by the availability of skilled labor.
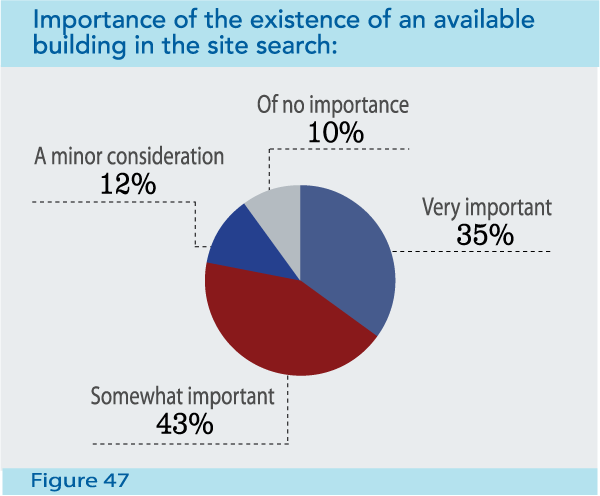
Another site selection factor showing a five-position jump in the rankings, as well as the greatest percentage increase in importance overall, is available land. This factor jumped from 18th to 13th position but, more importantly, it increased an astounding 21.3 percentage points and is now considered “very important” or “important” by 80.3 percent of the Corporate Survey respondents. Although communities do need available land to attract and grow businesses, especially those requiring large plots with room for expansion, this factor is usually contingent on the specific project and generally comes into play only after other site selection priorities have been met.
However, a deeper analysis of the importance of available land may be gleaned from a 2012 study of available land in the Portland, Oregon, metro area conducted by the Value of Jobs Coalition, a partnership of city and regional leaders, along with the Oregon chapter of NAIOP. According to the study results, “A consistent inventory of sites is a key requirement for meeting market demand, either by expanding local employers or attracting new employers.” And although not all firms require large sites, according to the study, “Nationally or globally scaled firms that can have a significant impact on regional economic growth…do require large parcels.”
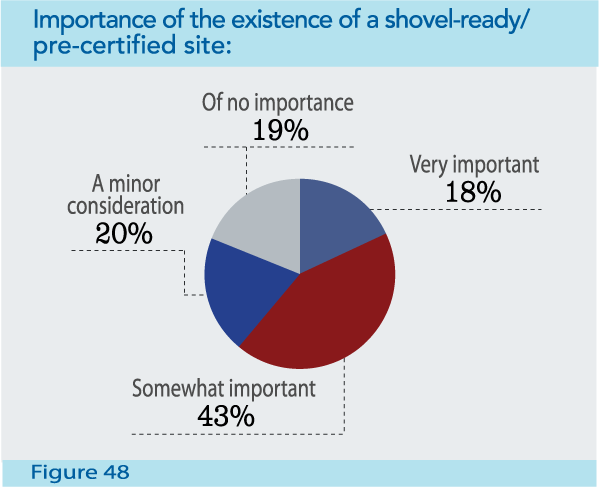
In a related question, we asked our Corporate Survey takers about the importance of the existence of a shovel-ready or pre-certified site in the location process. More than 60 percent deem this an important consideration (Slideshow, Figure 48). Consequently, if a community does not have an available site with proper infrastructure and utilities in place, it may be passed over by those looking to build a new facility.

Availability of long-term financing showed the third-highest percentage increase in importance, jumping 11.7 percentage points and considered “very important” or “important” by nearly three quarters of the survey respondents, but just moving up one spot to 16th in the rankings. Businesses considering new facility or expansion projects need access to long-term financing in order to proceed with their projects without tying up their available resources.
Although the railroad service factor is usually ranked near the bottom of the list of site selection factors, this year it shows the largest decrease in the importance ratings — minus 14.2 percentage points and only considered “very important” or “important” by 29.4 percent of the Corporate Survey respondents. Since shipping goods by rail is more fuel-efficient than shipping over the road, the only explanation that can be offered for the decrease in importance of this factor is the makeup of the respondent pool, i.e., 51 percent in the non-manufacturing and non-warehouse/distribution sectors.
Quality-of-life factors are ranked separately from the other site selection factors. Nevertheless, only one quality-of-life factor would be rated among the top-10 factors overall — low crime rate, with a combined “very important” or “important” rating of 80.9 percent. This is historically the top-ranked quality-of-life factor, despite the fact that the U.S. crime rate has dropped over the last two decades.
Although rankings of the nine quality-of-life factors don’t change dramatically from year to year, eight of the nine quality-of-life factors have actually seen their combined importance ratings increase. As the economy improves, there might be more focus on life outside the workplace. Additionally, the highly skilled workers need by today’s advanced technology firms are more mobile and look for desirable places to live, as well as work (see article on “quality of place” in this issue). With that in mind, the quality-of-life factor showing the largest percentage increase in importance — up 13.5 percentage points with a combined “very important” or “important” rating of 66.4 percent — is recreational opportunities.
Also increasing nearly 10 percentage points are healthcare facilities and ratings of public schools. The increased importance of these two factors is no surprise considering the aging demographic of the current work force, as well as the pressing need for a qualified up-and-coming labor pool.

Sources of Information and Project Timelines
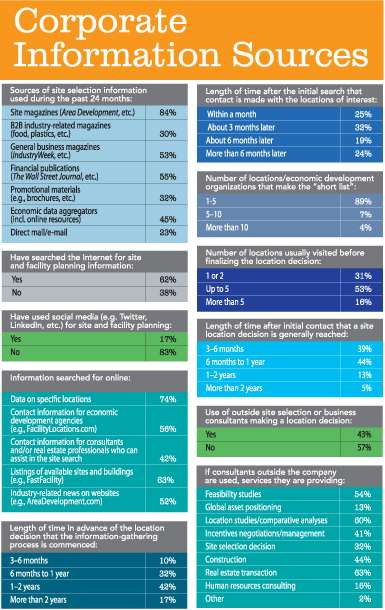
More than 80 percent of the Corporate Survey respondents say they utilize site magazines like Area Development for information upon which to base their location decisions. About half also use general business and financial publications as a site selection resource.
While 62 percent of the respondents search the Internet for site and facility planning information, 83 percent claim social media, e.g., Twitter, LinkedIn, etc., is not utilized in this capacity. Three quarters search online for data on specific locations; more than 60 percent are looking for listings of available sites and buildings, such as those found on FastFacility, for example; and more than half search for contact information at economic development organizations, as well as for industry-related news on websites like AreaDevelopment.com.
Forty-two percent of the survey respondents say they start the information-gathering process from three months to a year out, with nearly 60 percent making contact with the locations of interest from a month to three months later. An overwhelming majority (89 percent) put between one and five locations on their “short list,” and about half will visit up to five of those finalist locations before making their site selection decision, while a third will just visit one or two. Generally, most location decisions are made within three months to a year of initial contact, say more than 80 percent of the respondents.
Nearly 60 percent of those responding to our 28th annual Corporate Survey say they do not use outside consultants when making a location decision. Of those that do, 60 percent ask the consultants to perform location studies/comparative analyses and/or the real estate transaction. About 40 percent of those utilizing consultants’ services do so for incentives negotiations and management as well as in the construction process.
In Sum
The results of the 28th Annual Corporate Survey do show a modest improvement in short-range new facility and expansion plans. With 70 percent of the survey respondents expecting the economy to achieve a more continuous growth track by this year or next, more of them are rolling out plans for new facilities or expansions sooner rather than later, according to the survey results.
There’s also been a realignment of site selection priorities, with the need for skilled labor being the most critical concern. A quarter of this year’s respondents actually say this shortage is preventing them from spending more of their earnings on investment in U.S. facilities — up from 19 percent who cited that factor in 2012 in response to this question. And, the percentage blaming their reluctance to spend on the new healthcare regulations under the Affordable Care Act jumped from 39 percent to 52 percent now that the ACA went into effect.
The latest Duke University/CFO Magazine Global Business Outlook Survey, concluded in December, reveals that nearly half of U.S. companies are reluctant to hire full-time workers because of the ACA. Companies only plan to increase full-time employment by 1.4 percent in 2014, according to that survey.
“I doubt advocates of this legislation would have foretold the negative impact on employment,” said Campbell R. Harvey, a professor of Finance at Duke Fuqua School of Business and a founding director of the survey. “The impact on the real economy is startling. Nearly one third of firms may either terminate employees or hire fewer people in the future as a direct result of ACA.”
Despite these concerns, 52 percent of the CFO magazine survey respondents say economic conditions for their firms will be better this year than last, with a projected 7.3 percent increase in capital spending.
After the 18-month long Great Recession, which officially ended in June 2009; economic growth in fits and starts since then; and just modest increases in employment; it’s hard to say when we will see more of an upward economic trajectory. Yet, if economic optimists are correct and growth tops 3 percent this year, it would be the first time it has done so for a full calendar year since 2005. If this happens, we can expect to see next year’s Corporate Survey takers continue to bump up their investments in new facilities, expansions, and hiring. We can also expect more investment in work force development — a subject that Area Development will cover in greater detail in a special publication to be produced this spring as we continue to address the needs of our corporate readers.


