These statements are all true. But this is also true: Wages aren’t growing as robustly as economists would expect given an unemployment rate of 4.4%. Not nationally, and not in most metro areas.
Emsi analyzed 2012-2016 private-sector industry earnings, adjusted to 2016 dollars, for every metropolitan and micropolitan statistical area. Here’s what we found:
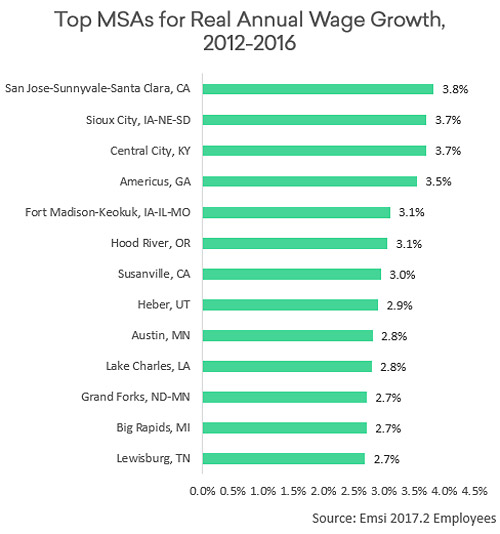
- Real wages per job grew by 3% or more on average annually the last five years in just 19 of 934 MSAs. Only four of these—San Jose; Sioux City, Iowa-Nebraska-South Dakota; Lake Charles, Louisiana; and Grand Forks, North Dakota-Minnesota—have populations above 100,000.
- A slightly broader group, 51 MSAs, grew real wages by 2% on average per year. Of these, San Jose and Seattle were the only major metros.
- Only five of the 100 most populous metros experienced real wage gains of at least 2%: San Jose, Seattle, San Francisco, Raleigh, and Madison.
- Real wages declined in 139 MSAs from 2012-2016. Bridgeport, Connecticut, was the largest metro to see real wage decline (-0.3% on average per year). Durham-Chapel, North Carolina, Peoria, Illinois, and Lafayette, Louisiana, were three mid-sized metros that also saw drops.
- These trends aren’t isolated to the last five years. From 2001-2016, real wages increased by at least 3% annually in just 10 MSAs. Three of these are small, oil-dominated MSAs, led by Williston, North Dakota, where salaries have dipped or flatlined since 2012, coinciding with the oil and gas bust.
Nationally from 2012-2016, real wages increased 0.8% per year in the private sector, according to our analysis. That’s better than 2001-2007, a period of economic expansion (except for the 2001 recession) during which real wages averaged 0.5% annual growth.
A handful of communities are doing far better than the nation in wage growth, and a larger group is doing far worse. What follows is a look at the top MSAs over the last five years and the industries influencing these trends in these regions. (Note: Strong wage growth in a metro is good news for workers. For employers, however, it could mean they can’t find talent and need to look at other markets to find workers or expand/move operations.)

The San Jose metro area is leaps and bounds above every major city in average real wage growth. Annually from 2012-2016, salaries in San Jose increased 3.8% in inflation-adjusted terms. That’s a jump of 19% for the five-year period, better than the 14% uptick in private-sector jobs over the same time.
In 2016, the average private-sector salary in San Jose was $118,541—the highest average salary of any MSA in the U.S. and $31,000 higher than second-best Bridgeport, Connecticut ($87,573). Real wages in Bridgeport, as mentioned above, have declined since 2012 (and since 2007).
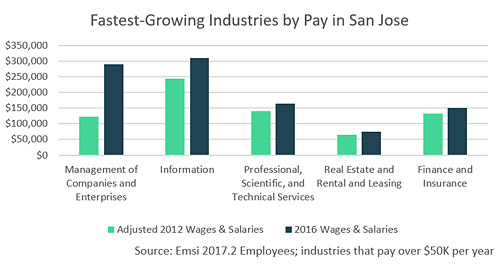
Wages are up across every major industry sector in San Jose. Management of companies and enterprises—mostly corporate headquarters jobs in San Jose—is the fastest-growing sector for wages (up 136% adjusted to 2016 dollars). The average salary in the information sector is up 27% to nearly $310,000, and most of this growth has come in internet publishing and broadcasting and web search portals (NAICS 51913). {{RELATEDLINKS}}
San Jose has the highest density of tech workers in the nation, per CompTIA’s analysis of Emsi data. The innovation sector in Silicon Valley is clearly lifting compensation in the service sector. Case in point: wages grew 6% in retail trade and 9% in educational services (9%) in San Jose.
Wages are also up in other tech metros—but not in every case. For example, Seattle’s inflation-adjusted average salary rose 2.1% annually from 2012-2016, and San Francisco’s rose 1.9%. But Austin’s real wages increased right at the national average (0.8% per year) while Denver (0.6%) and Boulder (0.7%) were below the national average.
No. 2 in real wage growth behind San Jose is Sioux City, Iowa-Nebraska-South Dakota, at 3.7%. This MSA of almost 170,000 people has seen a massive boom in construction jobs (up 99% since 2012) and wages (up 71%).
Manufacturing is the largest-employing sector in Sioux City, with more than 15,000 jobs (almost 20% of all private-sector employment). Manufacturers in Sioux City have increased average real wages 13% the last five years, three times faster than the increase in manufacturing jobs (4%).
- Central City, Kentucky (3.7%)
- Americus, Georgia (3.5%)
- Fort Madison-Keokuk, Iowa-Illinois-Missouri (3.1%)
- Hood River, Oregon (3.1%)
- Susanville, California (3.0%)
- Heber, Utah (2.9%)
- Austin, Minnesota (2.8%)
- Lake Charles, Louisiana (2.8%)
- Grand Forks, North Dakota-Minnesota (2.7%)
These numbers indicate the job recovery hasn’t been coupled with a wage rally in most of the U.S., especially in the biggest cities. That said, inflation grew less than 1% in 2014 and 2015 and has hovered at or below 2% every year since the recession. This means in metros with at least solid wage growth, workers are getting ahead, if ever so slightly.
After the jobs report last week, Neil Irwin of the New York Times wrote that because of low inflation and weak productivity growth it’s not surprising to see marginal wage gains. Nonetheless, our analysis suggests that the labor market might not be as tight as the data shows—or at least not tight enough for businesses in aggregate to significantly drive up wages.
About This Analysis
We used Emsi’s Q2 2017 data release and looked at average annual salaries for wage-and-salary employees in all private-sector industries. These earnings numbers show wages and salaries for all workers in each industry, from C-suite executives to administrative staff, using QCEW-reported earnings and include commissions, overtime pay, hazard pay, bonuses, stock options, and severance pay. They do not include supplements to income like pensions and contributions to 401(k) plans.
This analysis was originally posted on the Emsi blog. Data for this post comes from Emsi Developer, a labor market and economic data analysis tool that hundreds of economic development organizations and workforce boards use on a daily basis.