Subscribe
Close
  • Free for qualified executives and consultants to industry

  • Receive quarterly issues of Area Development Magazine and special market report and directory issues

Renew

North American Seaport Outlook: Potential Shift in Ports of Call

Q3 2015
With recent labor as well as congestion issues taking a toll on West Coasts ports, industrial seaport markets may be affected by next year’s opening of the expanded Panama Canal. It is projected that by 2016, 87 percent of the world’s shipping fleet will be able to traverse the Panama Canal, which will be able to accommodate 12,000 to 14,000 TEU vessels.

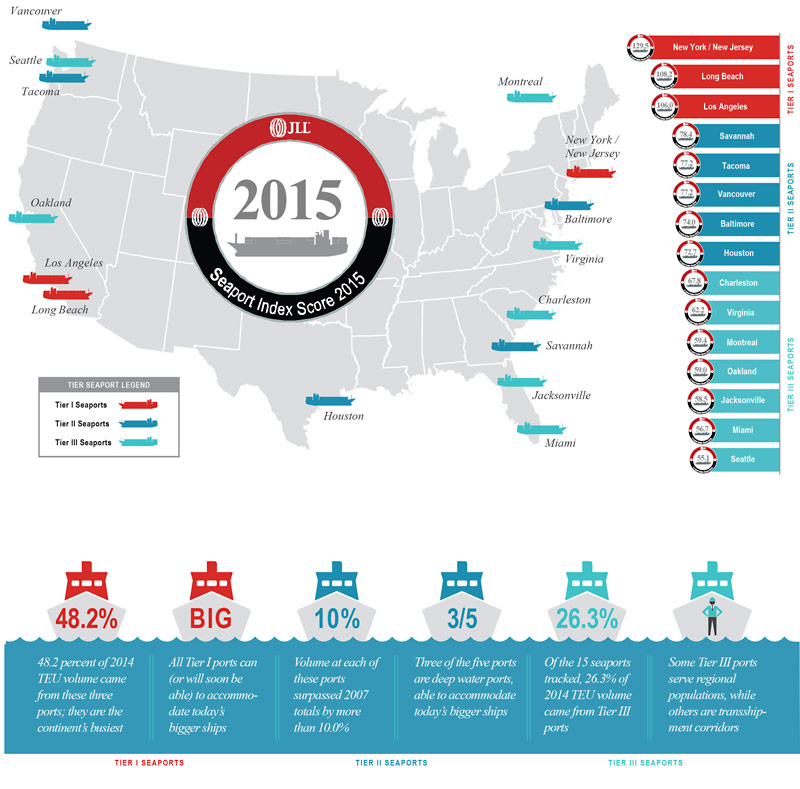
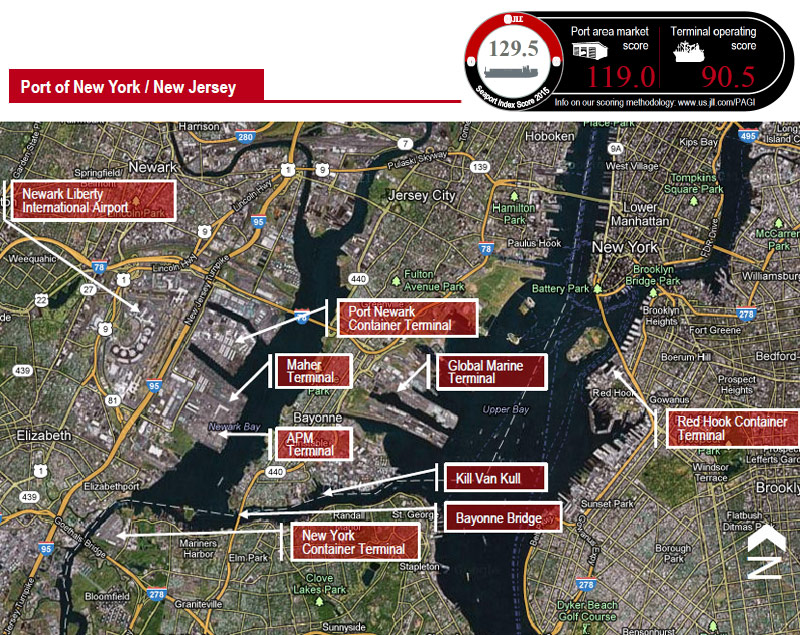
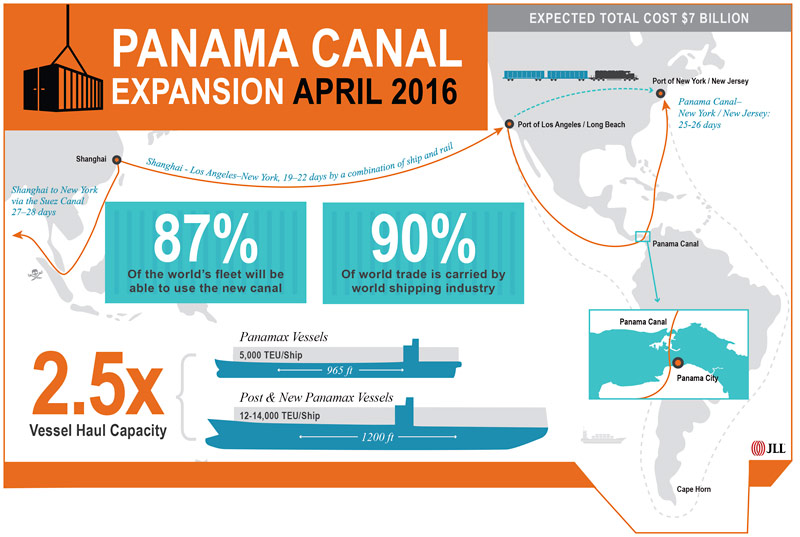
According to JLL’S 2015 North American Seaport Outlook, Gulf and Eastern Seaboard ports, which are already leading in TEUs, are anticipated to capture even more West Coast discretionary cargo when the new Panama Canal opens next year; keep in mind, however, that discretionary goods are those not destined for local consumption, and thereby able to move through any entry point of the shipper’s choosing. As JLL notes, it’s a matter of where goods ultimately end up rather than where they enter the continent. Therefore, seaport markets based in notable population centers, e.g., New York/New Jersey (40.9 percent increase in TEU volume from 2007 to 2014), are currently faring well.
SlideshowSeaport Index Score 2015 2015 Seaport Outlook
Close

North American Seaport Outlook

  • Seaport Index Score 2015 Seaport Index Score 2015
  • New York / New Jersey is North America’s third busiest seaport and has this year’s highest CRE score, due to several large block availabilities near the waterfront; inventory, however, is quite old and dates back to the 1950s. Annual TEU volume was up 5.6 percent in 2014, outpacing Los Angeles and Long Beach, and will only grow once the Bayonne Bridge is raised in 2016 to allow passage of larger vessels. Overall, the port is an excellent position to capture West Coast TEU market share when an expanded Panama Canal opens in 2016. New York / New Jersey is North America’s third busiest seaport and has this year’s highest CRE score, due to several large block availabilities near the waterfront; inventory, however, is quite old and dates back to the 1950s. Annual TEU volume was up 5.6 percent in 2014, outpacing Los Angeles and Long Beach, and will only grow once the Bayonne Bridge is raised in 2016 to allow passage of larger vessels. Overall, the port is an excellent position to capture West Coast TEU market share when an expanded Panama Canal opens in 2016.
  • Long Beach ranks second in the continent’s TEU volume, however, its 2014 year - over-year totals were flat at 1.3 percent; labor negotiations and work slowdowns by the ILWU did not favor the port in late 2014 through the first half of 2015 — as many shippers routed cargo to the eastern seaboard. Industrial stock within a 15 - mile radius of the port totals 197.3 million square feet, has an average construction date of 1978 and a tight 4.0 percent vacancy rate. Long Beach ranks second in the continent’s TEU volume, however, its 2014 year - over-year totals were flat at 1.3 percent; labor negotiations and work slowdowns by the ILWU did not favor the port in late 2014 through the first half of 2015 — as many shippers routed cargo to the eastern seaboard. Industrial stock within a 15 - mile radius of the port totals 197.3 million square feet, has an average construction date of 1978 and a tight 4.0 percent vacancy rate.
  • Los Angeles remains North America’s busiest seaport and its APM terminal is among the most automated on the continent – factors that contributed to it receiving this year’s highest shipping score. Limited space availability near the port, however, tugged down on its CRE score. Although Los Angeles’s overall score places it in third, its 2014 TEU volume exceeded New York / New Jersey’s by a factor of 1.4x. Los Angeles remains North America’s busiest seaport and its APM terminal is among the most automated on the continent – factors that contributed to it receiving this year’s highest shipping score. Limited space availability near the port, however, tugged down on its CRE score. Although Los Angeles’s overall score places it in third, its 2014 TEU volume exceeded New York / New Jersey’s by a factor of 1.4x.
  • Savannah is North America’s fourth busiest cargo seaport, and has recorded exponential volume growth over the last decade. Three - year TEU totals were up 12.5 percent in 2014, and new industrial development is on the rise in this ever - evolving transshipment corridor. With direct rail lines to Atlanta, Savannah’s cargo volumes will only increase once a newly expanded Panama Canal opens in 2016. It, along with New York / New Jersey, Virginia and Charleston, is where West Coast discretionary cargo will likely land. Savannah is North America’s fourth busiest cargo seaport, and has recorded exponential volume growth over the last decade. Three - year TEU totals were up 12.5 percent in 2014, and new industrial development is on the rise in this ever - evolving transshipment corridor. With direct rail lines to Atlanta, Savannah’s cargo volumes will only increase once a newly expanded Panama Canal opens in 2016. It, along with New York / New Jersey, Virginia and Charleston, is where West Coast discretionary cargo will likely land.
  • Tacoma and Seattle, both deep water ports (and once fierce rivals), formed an alliance in late 2014 to collectively manage cargo operations and vie for market share. Tacoma’s 3 - year TEU volume was up 38.2 percent in 2014, which can be traced to a consortium of shippers that relocated their operations to the port from Seattle. Industrial vacancy in the immediate area is a tight 5.7 percent, and the port is located in an area where a fair share of greater Seattle’s industrial development is occurring. Tacoma and Seattle, both deep water ports (and once fierce rivals), formed an alliance in late 2014 to collectively manage cargo operations and vie for market share. Tacoma’s 3 - year TEU volume was up 38.2 percent in 2014, which can be traced to a consortium of shippers that relocated their operations to the port from Seattle. Industrial vacancy in the immediate area is a tight 5.7 percent, and the port is located in an area where a fair share of greater Seattle’s industrial development is occurring.
  • Vancouver, another deep water port, is North America’s fifth busiest containerized cargo seaport, and is a new addition to this year’s report. It is a viable Plan B to U.S. West Coast ports of call, whose operations have had their share of hiccups in recent years due to labor issues. Rail connectivity is strong, and industrial stock near the waterline has an average construction date of 1992, which is second to Savannah in terms of modernity. Vancouver, another deep water port, is North America’s fifth busiest containerized cargo seaport, and is a new addition to this year’s report. It is a viable Plan B to U.S. West Coast ports of call, whose operations have had their share of hiccups in recent years due to labor issues. Rail connectivity is strong, and industrial stock near the waterline has an average construction date of 1992, which is second to Savannah in terms of modernity.
  • Baltimore is among a handful of deep water ports in North America and its shipping score remained nearly unchanged from last year’s report. The seaport’s CRE score was down, however, due to tightening market fundamentals decreasing available space options. Unfortunately, a proposed CSX intermodal facility to bring double - stacking capabilities to the port was recently shelved due to state funding issues; a key infrastructure issue now being addressed by the port’s newly elected administration. In July, Maersk – after a nearly two - decade absence from Baltimore – began calling on the port again. Baltimore is among a handful of deep water ports in North America and its shipping score remained nearly unchanged from last year’s report. The seaport’s CRE score was down, however, due to tightening market fundamentals decreasing available space options. Unfortunately, a proposed CSX intermodal facility to bring double - stacking capabilities to the port was recently shelved due to state funding issues; a key infrastructure issue now being addressed by the port’s newly elected administration. In July, Maersk – after a nearly two - decade absence from Baltimore – began calling on the port again.
  • Dredging of Houston’s key navigational channels continue in an investment - play to vie for future TEU traffic. Industrial vacancy near the waterline is 3.7 percent, but may increase over the coming months due to the ‘hit-the-brakes’ slowdown in oil production. Stock further inland will likely be impacted as well. Houston’s score was fairly consistent with last year’s report Dredging of Houston’s key navigational channels continue in an investment - play to vie for future TEU traffic. Industrial vacancy near the waterline is 3.7 percent, but may increase over the coming months due to the ‘hit-the-brakes’ slowdown in oil production. Stock further inland will likely be impacted as well. Houston’s score was fairly consistent with last year’s report
  • Charleston’s shipping score was elevated this year due to explosive 3 - year TEU volume growth to the tune of 40.8 percent. Although the port’s immediate industrial base is a diminutive 20.4 million square feet, the seaport offers on - dock, double - stacking rail lines that run through Greer, SC, where a new intermodal port opened in late 2013. Several international manufacturers (namely automotive) have operations at the site and export their product through Charleston to European markets. Charleston’s rail connections also run to Atlanta. Just outside of Charleston, Volvo Cars announced it will invest $500 million to build its first U.S. factory. With an anticipated completion date of 2018, the new facility will likely increase Ro-Ro activity at the port, while, at the same time, lure some of Volvo’s suppliers to lease nearby space in the region. Charleston’s shipping score was elevated this year due to explosive 3 - year TEU volume growth to the tune of 40.8 percent. Although the port’s immediate industrial base is a diminutive 20.4 million square feet, the seaport offers on - dock, double - stacking rail lines that run through Greer, SC, where a new intermodal port opened in late 2013. Several international manufacturers (namely automotive) have operations at the site and export their product through Charleston to European markets. Charleston’s rail connections also run to Atlanta. Just outside of Charleston, Volvo Cars announced it will invest $500 million to build its first U.S. factory. With an anticipated completion date of 2018, the new facility will likely increase Ro-Ro activity at the port, while, at the same time, lure some of Volvo’s suppliers to lease nearby space in the region.
  • Virginia, primarily a transshipment corridor, is a deep water seaport with robust rail connections; namely, Norfolk Southern’s double - stacked Heartland Corridors runs directly from the port to Columbus and Chicago. Like many seaports, “enhancing capacity” and “easing congestion” are big themes at Virginia via the Craney Island’s expansion and the Midtown Tunnel project. Quality large blocks of space are scarce, and larger occupiers are gravitating towards build-to-suits. In the end, Virginia’s score was virtually unchanged from last year. Virginia, primarily a transshipment corridor, is a deep water seaport with robust rail connections; namely, Norfolk Southern’s double - stacked Heartland Corridors runs directly from the port to Columbus and Chicago. Like many seaports, “enhancing capacity” and “easing congestion” are big themes at Virginia via the Craney Island’s expansion and the Midtown Tunnel project. Quality large blocks of space are scarce, and larger occupiers are gravitating towards build-to-suits. In the end, Virginia’s score was virtually unchanged from last year.
  • Montreal has the shallowest waterway in this study at 37 feet, and is therefore unable to accommodate today’s larger, more modern vessels. What it lacks in TEU potential, it makes up for in industrial stock however: Montreal’s seaport-near inventory totals 209.7 million square feet, second only to New York / New Jersey’ stock. The port is a new addition to our scoring index. Montreal has the shallowest waterway in this study at 37 feet, and is therefore unable to accommodate today’s larger, more modern vessels. What it lacks in TEU potential, it makes up for in industrial stock however: Montreal’s seaport-near inventory totals 209.7 million square feet, second only to New York / New Jersey’ stock. The port is a new addition to our scoring index.
  • Oakland remains a key gateway in transpacific trade, but had generally flat annual and 3 -year TEU growth. This, in turn, caused a decrease in its shipping score. Industrial stock around the port has an average build date of 1963, and this often prompts occupiers to look further inland –a trend Oakland Global Trade and Logistics Center hopes to reverse: The new development will strengthen existing on-dock rail connections and include new logistics facilities. Oakland remains a key gateway in transpacific trade, but had generally flat annual and 3 -year TEU growth. This, in turn, caused a decrease in its shipping score. Industrial stock around the port has an average build date of 1963, and this often prompts occupiers to look further inland –a trend Oakland Global Trade and Logistics Center hopes to reverse: The new development will strengthen existing on-dock rail connections and include new logistics facilities.
  • Jacksonville outpaced Miami in 2014 TEU volume and also has more available industrial space options near and around the port. However, it slipped in this year’s rankings as Charleston and Virginia recorded big increases in their TEU volumes. Jacksonville’s importance as a major regional port remains undiminished, however, and plans are underway to deepen St. Johns River to 47 feet. Jacksonville outpaced Miami in 2014 TEU volume and also has more available industrial space options near and around the port. However, it slipped in this year’s rankings as Charleston and Virginia recorded big increases in their TEU volumes. Jacksonville’s importance as a major regional port remains undiminished, however, and plans are underway to deepen St. Johns River to 47 feet.
  • Miami’s overall score generally held steady this year, and it serves a regional population that is otherwise costly to reach from other ports. Miami is in a battle with other eastern seaboard ports to broaden its appeal to a wider set of shippers however, and its hope resides in $2.0 billion in capital investments. Miami is on track to be Post-Panamax ready this year. Miami’s overall score generally held steady this year, and it serves a regional population that is otherwise costly to reach from other ports. Miami is in a battle with other eastern seaboard ports to broaden its appeal to a wider set of shippers however, and its hope resides in $2.0 billion in capital investments. Miami is on track to be Post-Panamax ready this year.
  • Seattle’s shipping score decreased on account of “The Grand Alliance”: A partnership of NYK, OOCL, Hapag-Lloyd and Zim, which shifted their operations to Tacoma in late 2013. With them went substantial TEU traffic. Seattle’s immediate vacancy is a mere 3.5 percent –the lowest in this year’s study. Limited available supply is constraining new leasing activity. Seattle’s shipping score decreased on account of “The Grand Alliance”: A partnership of NYK, OOCL, Hapag-Lloyd and Zim, which shifted their operations to Tacoma in late 2013. With them went substantial TEU traffic. Seattle’s immediate vacancy is a mere 3.5 percent –the lowest in this year’s study. Limited available supply is constraining new leasing activity.
  • Panama Canal Expansion - 2016 Panama Canal Expansion - 2016
  • Global Trade Trends Hit Home Global Trade Trends Hit Home
JLL’s research reveals that, although the ports of Long Beach and Los Angeles will remain the primary U.S. gateways, Gulf and Eastern Seaboard ports are anticipated to capture even more West Coast discretionary cargo when the new Panama Canal opens next year.
It’s anticipated that the ports of Long Beach and Los Angeles, which have a collective TEU volume 2.5 times that of New York/New Jersey, will remain the primary U.S. gateways in the years to come based on their infrastructure, automation enhancements, and strong rail connectivity to interior U.S. markets. However, East Coast ports in Savannah, Charleston, and Virginia — which also offer strong rail connections to interior population centers — will likely see more discretionary cargo call on their ports.

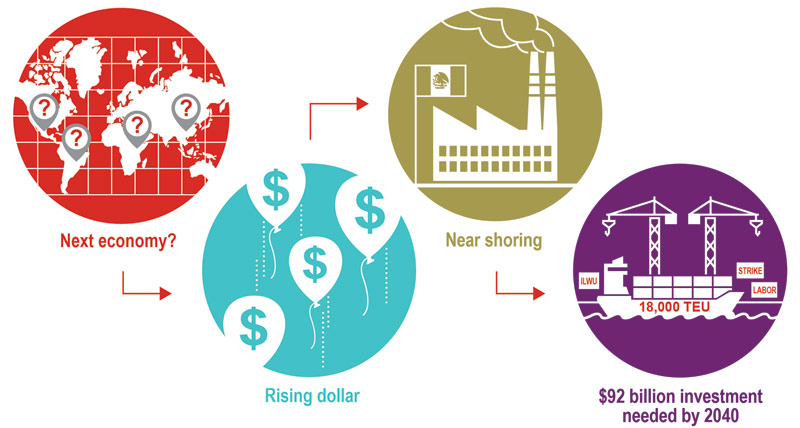
"Cost, service and risk are the three perennial drivers for supply chain executives as they develop their logistics strategy. As a result, the East Coast/Gulf seaports are gaining favor among industry veterans because they mitigate some risk, provide access to major population centers, and connect with the optimal inland transportation mode: rail,” noted Mark Levy, Managing Director and lead of JLL’s Ports, Airports and Global Infrastructure (PAGI) practice group.

As to demand for industrial space at the nation’s seaports, JLL explains it will not directly correlate to a shift in ports of call. There are too many complexities and variables in the movement of goods to portend a macro shift in industrial occupancy. It’s predicted that seaport markets with quality industrial real estate in nearby population centers will continue to see rents outpace greater market averages.

“We are seeing unprecedented industrial real estate growth around our nation’s seaports. Industrial real estate occupancy has grown by 17 million square feet in the West Coast seaport markets between 2007 and 2014 and rose 15 million square feet between 2013 and 2014 alone. The East Coast and Gulf of Mexico seaports had equally impressive gains and increased by 36.9 million square feet between 2007 and 2014,” Levy further noted.

Exclusive Research