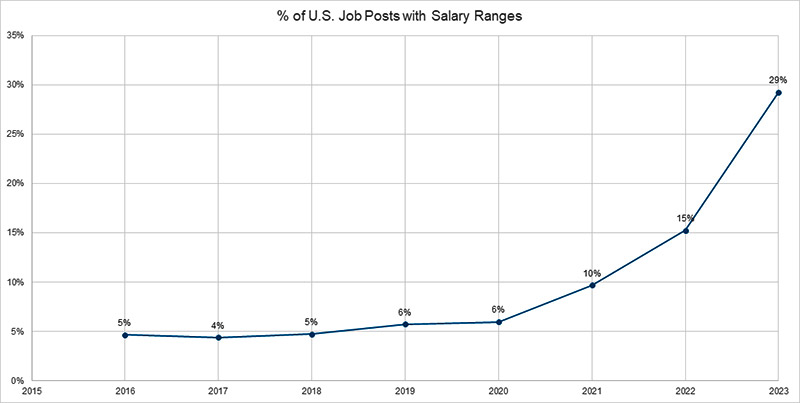
Is it rude to talk about money? Certain states and companies don’t seem to think so. In recent years, the trend of salary transparency in job descriptions has seen a significant rise, reflecting a broader shift towards openness and fairness in the workplace. According to an analysis conducted by Deloitte’s Labor Market Intelligence team of analyzing publicly available job postings, salary ranges were listed in 29 percent of all U.S. job posts in 2023, a considerable increase from only 10 percent in 2021. This change indicates a growing belief that salary transparency can benefit both employers and potential employees. However, certain roles and locations are more prone to salary transparency than others.

Is salary transparency limited to specific states?
In 2024, Hawaii, Illinois, Minnesota, Vermont, and Washington, DC joined California, Colorado, Connecticut, Maryland, Nevada, New York, Rhode Island, and Washington by enacting salary range transparency laws. While there are no legal requirements for salary transparency in 38 other U.S. states (other than a few local municipality laws), salary transparency is making its way across the country. Since the beginning of 2023, the average state has seen 22 percent of job posts include salary ranges. The state with the lowest coverage is Alabama, at 15.1 percent.
29
Which jobs have the highest salary transparency?
Government jobs such as protective service, transportation, judicial, and public works occupations all have high representation for salary transparency, attributed to government regulations on salary transparency. For private sector jobs, Sales and Marketing professional job postings have the highest concentration of salary transparency at 31 percent. Other top occupations include Production Occupations, Cooks and Food Preparers, Business Operations Specialists, and Financial Specialists.
Occupations with the lowest salary transparency include construction workers, architects, healthcare practitioners, and manufacturing supervisors.
Is salary range data accurate?
Deloitte's research suggests that advertised salaries align with market rates. From 2019 to 2024, job postings show an average salary discrepancy of just 5 percent compared to Bureau of Labor Statistics wages. Furthermore, the salary ranges listed in job descriptions have narrowed in recent years, reducing the disparity between the upper and lower ends. In 2022, there was an average 46% difference between the high end of the salary band and the low end of the salary band. That number decreased to 42 percent in 2023 and is currently 40 percent in 2024. In addition to the advertised salaries matching top industry wage estimates, the narrower salary bands are enhancing the precision of these estimates.
40
- An Additional View of Market Conditions - The rise of salary transparency has provided an additional source of insight into labor market dynamics, with timely wage range estimates by location, role, and company. Job seekers, economists, and human resource strategists can benefit from accessing the salary analytics available through job postings.
- Persisting Wage Inflation – According to both Deloitte research from job postings and the Bureau of Labor Statistics, wages are continuing to rise at rates higher than core inflation, with growth rates per year from 2019-2023 averaging 5 percent and 4 percent, respectively. While the Job Openings and Labor Turnover Survey suggests the labor market has been easing in recent months through rising unemployment and lower job openings, wage increases continue to be above historical averages, according to both job postings and the Occupation Employment and Wage Statistics.
- A Source for Competitor Analysis – Historically, tracking wages at the company and skill level for competitor benchmarking has been challenging for business strategists. However, the rise of salary transparency has cultivated a path for data-driven wage insights by more granular job details to build an informed talent strategy.

