Subscribe
Close
  • Free for qualified executives and consultants to industry

  • Receive quarterly issues of Area Development Magazine and special market report and directory issues

Renew

11th Annual Consultants Survey: Consultants’ Exhibit Confidence and Increasing Project Activity

The majority of those responding to the Consultants Survey feel the economy is already on a continuous growth track, which is reflected in the new facility and expansion plans of their clients.

Q1 2015
As 47 percent of the respondents to our 29th Annual Corporate Survey say they utilize the services of consultants when making plans for new facilities and/or expansions, we also ask the consultants to answer questions about their clients’ plans and site selection priorities. Needless to say, the responses do not line up entirely with those of our Corporate Survey respondents. The consultants’ responses, as well as a comparison to those of our corporate readers, follow.

Profile of the Responding Consultants
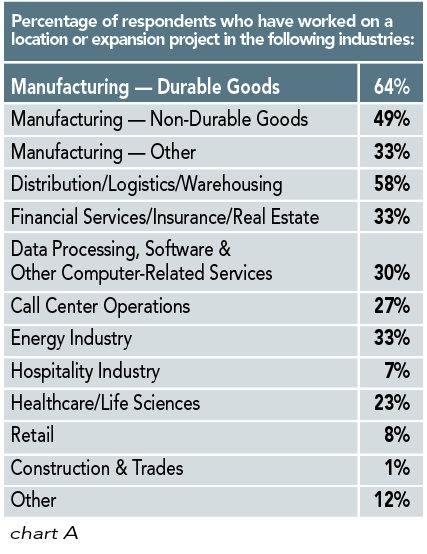
Nearly two thirds of those responding to our 11th Annual Consultants Survey have worked on location or expansion projects in the durable goods manufacturing sector and half in the nondurable goods manufacturing sector. Nearly 60 percent have assisted distribution/logistics/warehousing firms with their plans, and fully a third have worked with firms in financial services/insurance/real estate as well as the energy industry (chart A).

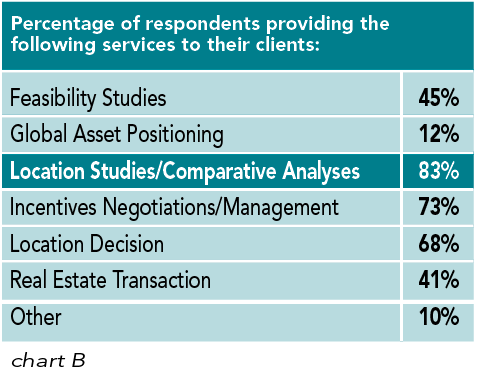
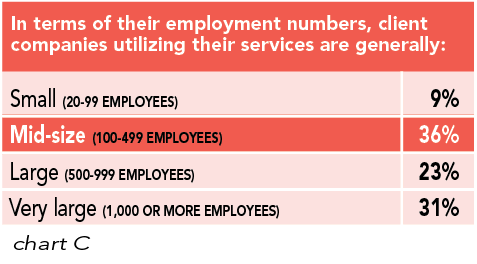
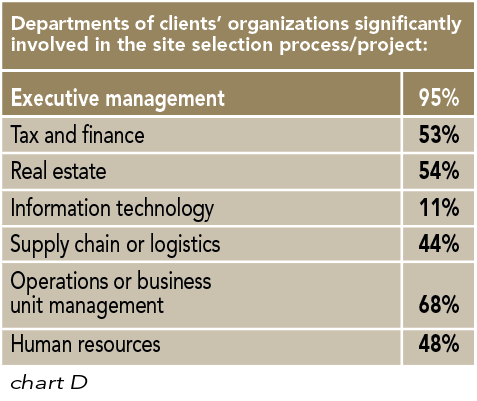
More than 80 percent of the responding consultants say they have helped their clients with location studies/comparative analyses, and nearly three quarters handle incentives negotiation and management for their clients. Interestingly, 68 percent claim to assistant in their clients’ location decisions (chart B). In terms of their employment numbers, 90 percent of the companies using the consultants’ services are mid-size to very large (100 to 1,000+ workers) (chart C). Since 32 percent of those responding to our Corporate Survey are with companies with fewer than 100 employees, we can see why the responses to our Corporate and Consultants surveys would differ.
Slideshow11th Annual Consultants Survey Chart F: Effect of the economic recovery on clients’ facility plans Chart F: Effect of the economic recovery on clients’ facility plans
Close
  • Chart A: Current operations of respondents Chart A: Percentage of respondents who have worked on a location or expansion project in the following industries
  • Chart B: Percentage of respondents providing the following services to their clients Chart B: Percentage of respondents providing the following services to their clients
  • Chart C: In terms of their employment numbers, client companies utilizing their services are generally Chart C: In terms of their employment numbers, client companies utilizing their services are generally
  • Chart D: Departments of clients’ organizations significantly involved in the site selection process/project Chart D: Departments of clients’ organizations significantly involved in the site selection process/project
  • Chart E: Most of the clients who ask consultants to perform a location search have Chart E: Most of the clients who ask consultants to perform a location search have
  • Chart F: Effect of the economic recovery on clients’ facility plans Chart F: Effect of the economic recovery on clients’ facility plans
  • Chart G: Believe the economic recovery has achieved a continuous growth track Chart G: Believe the economic recovery has achieved a continuous growth track
  • Chart H: Most of the client companies that expect to open new facilities plan to do so within Chart H: Most of the client companies that expect to open new facilities plan to do so within
  • Chart I: Number of new domestic facilities average client plans to open Chart I: Number of new domestic facilities average client plans to open
  • Chart J: Clients’ domestic location projects are slated for the following regions (as a percentage of total
                new domestic projects) Chart J: Clients’ domestic location projects are slated for the following regions (as a percentage of total new domestic projects)
  • Chart K: Types of new domestic facilities clients are opening (as a percentage of total new domestic projects) Chart K: Types of new domestic facilities clients are opening (as a percentage of total new domestic projects)
  • Chart L: Number of new foreign facilities average client plans to open Chart L: Number of new foreign facilities average client plans to open
  • Chart M: Clients’ foreign location projects are slated for the following regions (as a percentage of total new foreign projects Chart M: Clients’ foreign location projects are slated for the following regions (as a percentage of total new foreign projects)
  • Chart N: Clients’ new facilities slated for Asia, will be located in the following nations (as a percentage of total planned Asian projects) Chart N: Clients’ new facilities slated for Asia, will be located in the following nations (as a percentage of total planned Asian projects)
  • Chart O: Types of new foreign facilities clients are opening (as a percentage of total new foreign projects) Chart O: Types of new foreign facilities clients are opening (as a percentage of total new foreign projects)
  • Chart Q: Most clients that expect to relocate facilities plan to do so within Chart Q: Most clients that expect to relocate facilities plan to do so within
  • Chart R: Of those clients planning to relocate facilities, the primary reasons for moving Chart R: Of those clients planning to relocate facilities, the primary reasons for moving
  • Chart S: Have seen an increase in the number of companies establishing foreign facilities as opposed to domestic ones over the last year Chart S: Have seen an increase in the number of companies establishing foreign facilities as opposed to domestic ones over the last year
  • Chart T: Issues preventing client companies from spending more of their earnings on investment in U.S. facilities Chart T: Issues preventing client companies from spending more of their earnings on investment in U.S. facilities
  • Chart U: Clients have relocated a facility back to the U.S. from a foreign location (reshored) Chart U: Clients have relocated a facility back to the U.S. from a foreign location (reshored)
  • Chart V: Consultants Survey 2014 Chart V: Consultants Survey 2014
  • Chart W: Combined Ratings Chart W: Combined Ratings
  • Chart X: Availability of skilled labor is having an effect on clients’ facility plans Chart X: Availability of skilled labor is having an effect on clients’ facility plans
  • Chart Y: Healthcare coverage mandated under the Affordable Care Act is affecting clients’ location decisions Chart Y: Healthcare coverage mandated under the Affordable Care Act is affecting clients’ location decisions
  • Chart Z: Quality of the workforce would be negatively affected in states that are legalizing marijuana use Chart Z: Quality of the workforce would be negatively affected in states that are legalizing marijuana use
  • Chart AA: Importance of water availability to clients’ operations Chart AA: Importance of water availability to clients’ operations
  • Chart BB: Water availability is affecting clients’ location decisions Chart BB: Water availability is affecting clients’ location decisions
  • Chart CC: New unconventional sources of energy (e.g., fracking) having an effect on client companies’ future location decisions Chart CC: New unconventional sources of energy (e.g., fracking) having an effect on client companies’ future location decisions
  • Chart DD: Sustainable development is more important to clients now than in the past Chart DD: Sustainable development is more important to clients now than in the past
  • Chart EE: If so, measures undertaken to reduce their companies’ carbon footprint Chart EE: If so, measures undertaken to reduce their companies’ “carbon footprint”
  • Chart FF: Relative importance of incentives to clients when making location decisions Chart FF: Relative importance of incentives to clients when making location decisions
  • Chart GG: Types of incentives clients consider most important when making a location decision Chart GG: Types of incentives clients consider most important when making a location decision
  • Chart HH: Clients have had to repay incentives monies because investment and/or job creation
                obligations were not met Chart HH: Clients have had to repay incentives monies because investment and/or job creation obligations were not met
  • Chart II: Communities you have worked with offering specifi c incentives for “green” initiatives Chart II: Communities you have worked with offering specifi c incentives for “green” initiatives
  • Chart JJ: Clients have encountered “green performance” requirements as a stipulation for receiving incentives Chart JJ: Clients have encountered “green performance” requirements as a stipulation for receiving incentives
  • Chart KK: Importance of the existence of an available building in clients’ site searches Chart KK: Importance of the existence of an available building in clients’ site searches
  • Chart LL: Importance of the existence of a shovel-ready/pre-certifi ed site in clients’ site searches Chart LL: Importance of the existence of a shovel-ready/pre-certifi ed site in clients’ site searches
  • Chart MM: Importance of businesses performing similar activities to clients in the area of search Chart MM: Importance of businesses performing similar activities to clients in the area of search
  • Chart NN: Importance of weather-related factors in clients’ location decisions Chart NN: Importance of weather-related factors in clients’ location decisions
Nearly all the responding consultants (95 percent) say executive management at their client organizations is involved in the location decision process. Two thirds also interact with operations or business unit management at client firms, and half say tax/finance and real estate departments are involved (chart D). More than 60 percent also say that clients who ask them to perform a location search have already gathered preliminary data and narrowed down the geographic area in which they wish to locate (chart E).

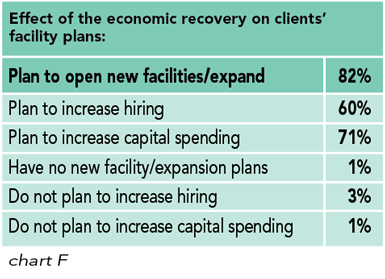
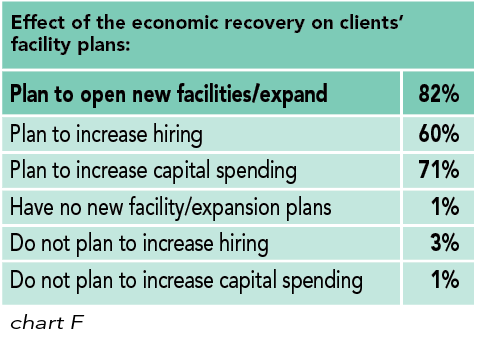
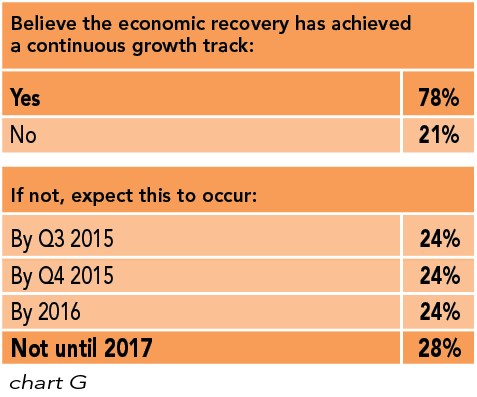
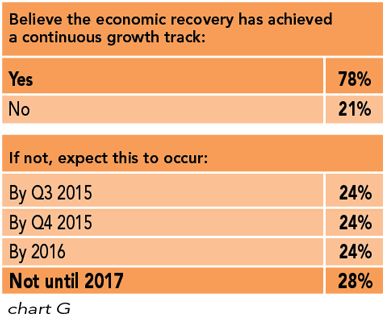
Since consultants are utilized by their clients once they’ve already initiated the location process, it follows that nearly all of the responding consultants say the economic recovery has had a positive effect on their clients’ facility plans: 82 percent claim their clients plan to open new facilities; 71 percent say they plan to increase capital spending; and 60 percent say their clients will also increase hiring (chart F). In fact, more than three quarters of those responding to our Annual Consultants Survey believe the economy has achieved a continuous growth track — twice the percentage of Corporate Survey respondents who hold that belief — and of those consultants who feel it has not, nearly half expect this to occur by year’s end (chart G).
Chart G: Believe the economic recovery has achieved a continuous growth track
Consultants’ Clients’ Facilities Plans
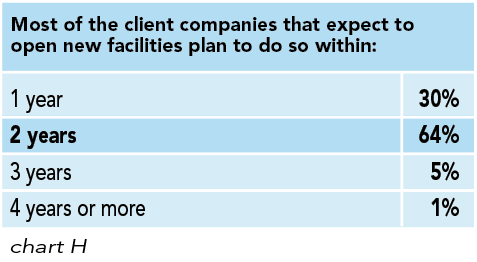
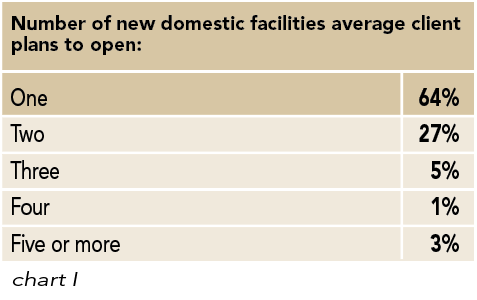
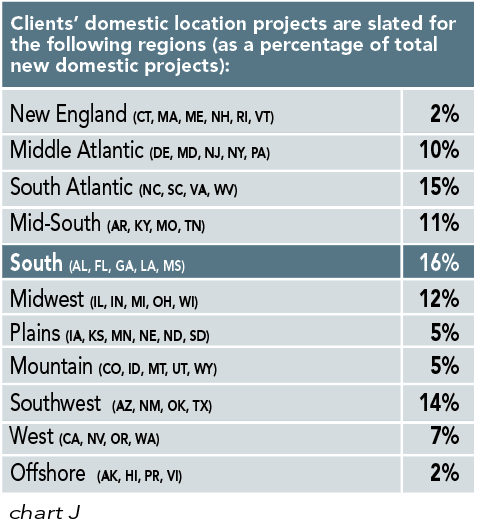
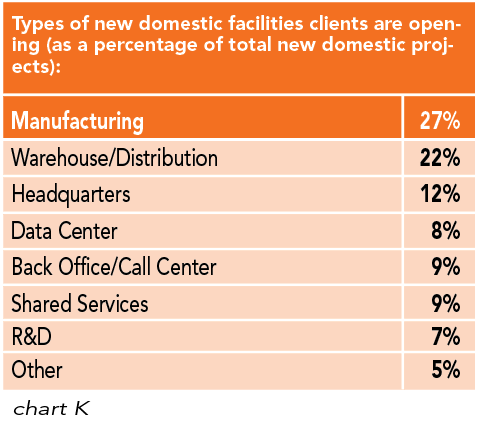
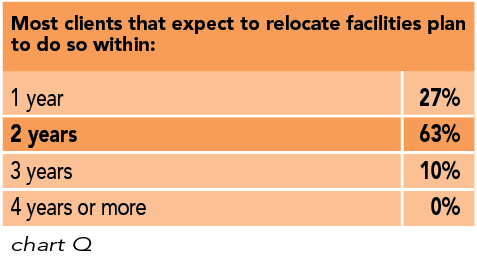
It also follows that most (94 percent) of the consultants say their client companies expect to open new facilities within one to two years (chart H). Of those, nearly two thirds say their clients will open just one domestic facility, and a quarter of the respondents claim these organizations will open two (chart I). The location of clients’ domestic projects differs somewhat from that reported by the respondents to our Annual Corporate Survey. The largest share of projects (16 percent) that the responding consultants are working on is slated for the South (Alabama, Florida, Georgia, Louisiana, Mississippi) and the South Atlantic (North Carolina, South Carolina, Virginia, West Virginia) (15 percent). Only 12 percent of their clients’ projects are to be located in the Midwest (Illinois, Indiana, Michigan, Ohio, Wisconsin), whereas our Corporate Survey respondents have slated 20 percent — the largest share — of their projects for that region (chart J). Roughly a quarter of the consultants’ client organizations’ projects are destined to house manufacturing operations, and more than 20 percent will be warehouse/distribution centers (chart K).

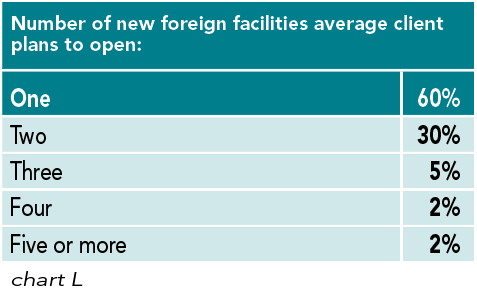
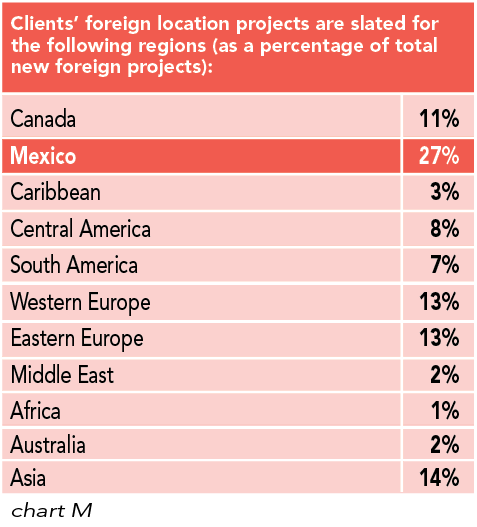
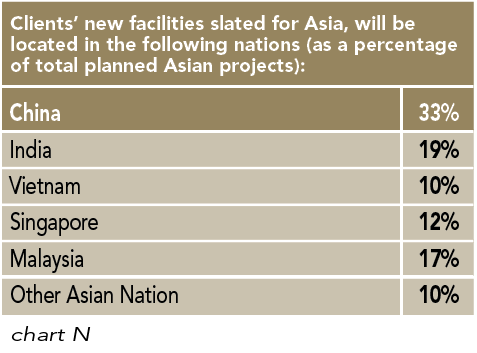
Sixty percent of those responding to the 11th Annual Consultants Survey say that, on average, their clients will open just one new foreign facility, while 30 percent claim they will open two (chart L). By comparison, nearly 40 percent of our Corporate Survey respondents claim they will open three or more foreign facilities. And while our Corporate Survey respondents say a quarter of their new foreign facilities are slated for Canada and 9 percent for Mexico, those responding to our Consultants Survey say only 11 percent of their clients’ projects will go to Canada and 27 percent to Mexico. The consultants are also working on many more projects for Eastern and Western Europe — 13 percent for each region — and fewer for Asia — just 14 percent as compared with 25 percent of those planned by the Corporate Survey respondents (chart M). When it comes to new Asian facilities, the consultants’ clients plan a third for China, 19 percent for India, and 17 percent for Malaysia, with the rest going to Vietnam, Singapore, or other Asian nations (chart N). The corporate respondents more heavily favored China and India.

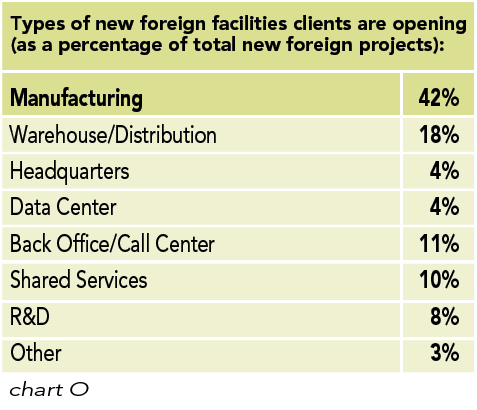
The responding consultants say that more than 40 percent of the new foreign facilities will be manufacturing plants and nearly a fifth are slated to serve as distribution/warehouse centers (chart O).
Chart R: Of those clients planning to relocate facilities, the primary reasons for moving
Again pointing to the fact that consultants are called upon once the location decision process has commenced, 93 percent of the respondents say their clients expect to expand facilities within the next year or two, and 90 percent say their clients expect to relocate facilities within that time frame as well (charts P and Q). Three quarters of the responding consultants claim their clients’ relocations plans are a result of the need to be in closer proximity to suppliers and/or markets served; about 60 percent say their clients need to relocate to satisfy labor force needs; and nearly half say clients’ relocations are a result of the need to cut labor costs (chart R).

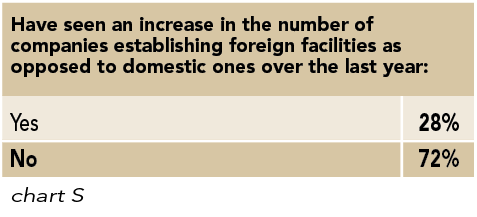
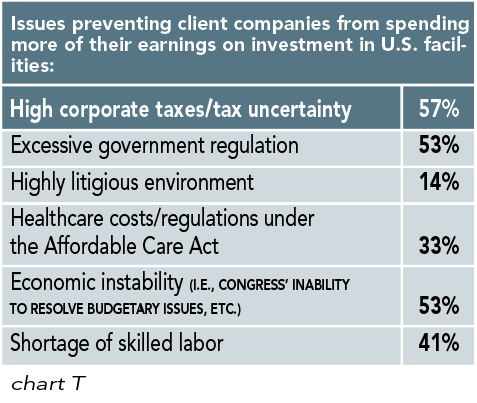
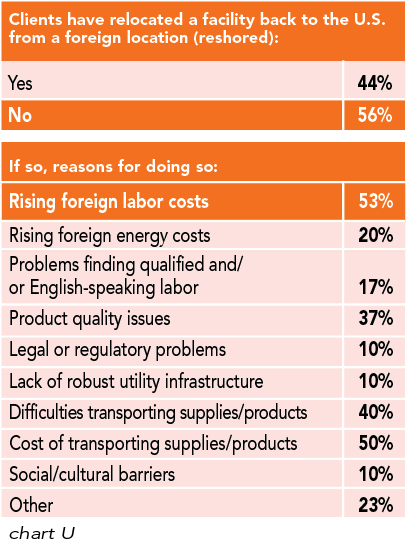
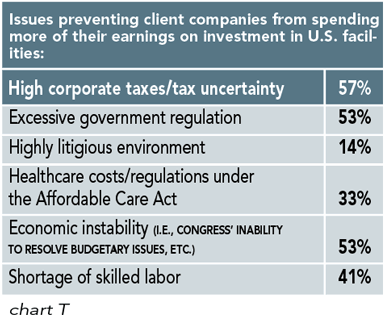
Although nearly all of the respondents to our Corporate Survey say they have no plans to relocate a domestic facility to offshore, a quarter of those responding to our Consultants Survey say they have seen an increase in the number of companies establishing foreign facilities as opposed to domestic ones in the last year (chart S). More than half of the consultants cite high corporate taxes, excessive government regulation, and economic instability (i.e., congressional budget woes) as the reasons preventing their client companies from spending more of their earnings on investment in U.S. facilities (chart T).
Chart T: Issues preventing client companies from spending more of their earnings on investment in U.S. facilities
And although 96 percent of the corporate respondents say they have no plans to relocate a foreign facility back to the U.S., nearly half of the responding consultants say their clients have reshored a facility. Half cite rising foreign labor costs and the cost of transporting supplies/products as the reasons for their clients’ reshoring moves, and more than a third also say there have been product quality issues with their clients’ foreign operations (chart U).

Next:Consultants’ Clients’ Location Priorities

Exclusive Research