The Boston Consulting Group’s latest research confirms manufacturing executives’ confidence in the U.S. economy. Some 16 percent of the 252 decision-makers at companies with sales of billion or more who were surveyed by BCG said they are already bringing production back from China to the U.S. — up from 13 percent the previous year. In fact, respondents to BCG’s survey said that the U.S. would account for an average of 47 percent of their total production within five years.
How do the aforementioned findings stack up against the plans of those corporate executives who utilize Area Development for their site and new facility planning and informational needs? In order to find out, we surveyed them in late fall 2014. Their responses are illustrated in the accompanying charts.


Some143 executives responded to our 29th Annual Corporate Survey. Of those, 35 percent are with manufacturing firms; 13 percent are in the financial services/insurance/real estate sector; and just 8 percent are with distribution/logistics providers (figure 1). More than two fifths (42 percent) are the chief executives or owners of their companies (figure 2), and more than 50 percent of the Corporate Survey respondents are responsible for their firms’ final location decision, with another 37 percent making preliminary recommendations (figure 3). In addition to executive management (85 percent), other departments involved in the location decision include operations management (61 percent), real estate (35 percent), and tax and finance (32 percent), among others (figure 4).
Nearly two thirds of our Corporate Survey respondents say their firms operate three or more domestic facilities, and half operate five or more foreign facilities (figure 5). More than 30 percent of the respondents also say their firms employ 100–499 people, while another 30 percent claim to employ 1,000 or more individuals (figure 6).
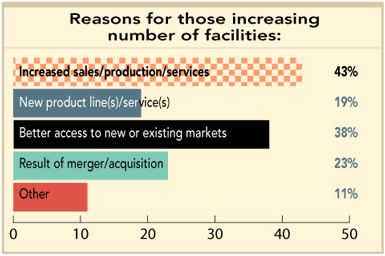
The number of their facilities has not changed over the last year for two thirds of the Corporate Survey respondents. Interestingly, though, 28 percent say they did increase their number of facilities (figure 7) for reasons ranging from increased sales/production (43 percent) to better access to new or existing markets (38 percent) (figure 8).
More than a third of the respondents to our 29th Annual Corporate Survey say the economic recovery has had a positive effect on their operations; i.e., they plan to open facilities, increase hiring, and/or increase capital spending. Another 35 percent, on the other hand, say they have no new facility plans resulting from the economic recovery (figure 10). In fact, 61 percent of the respondents believe the economy has not yet achieved a continuous growth track, with more than 70 percent saying it won’t do so until 2016 or 2017 (figure 11) — up from 59 percent of the prior year’s Corporate Survey respondents who expected continuous economic growth two years out.
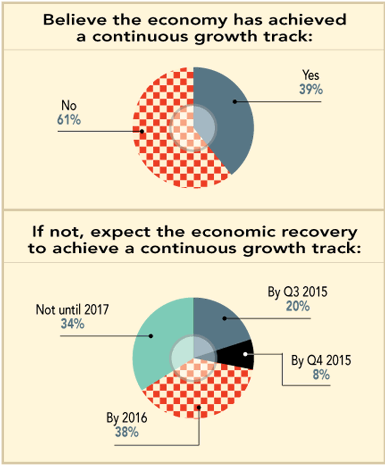
When asked about their plans for new facilities, only 36 percent of this year’s Corporate Survey respondents say they will open new facilities within the next two years (figure 12). This is down from 45 percent who said they had such expectations at the end of 2013. This is not surprising considering the fact that only 28 percent tell us they expect the economic recovery to achieve a continuous growth track by the end of this year.
Of those survey respondents with plans for new facilities, 39 percent expect to open just one domestic facility, and another 30 percent expect to open two (figure 13). The Midwest (Illinois, Indiana, Michigan, Ohio, Wisconsin) will garner a fifth of all the planned domestic facilities — up from 14 percent reported by the prior year’s Corporate Survey respondents. There’s also increased interest in the Southwest (Arizona, New Mexico, Oklahoma, Texas) — up from 11 percent to 14 percent this year — and the Mid-South (Arkansas, Kentucky, Missouri, Tennessee) — up from 9 percent to 11 percent of the planned domestic projects. Meanwhile, the South (Alabama, Florida, Georgia, Louisiana, Mississippi) with 17 percent and the South Atlantic (North Carolina, South Carolina, Virginia, West Virginia) with 12 percent of the planned new domestic facilities are consistent picks. However, less activity is planned for New England (Connecticut, Massachusetts, Maine, New Hampshire, Rhode Island, Vermont) — down from 6 percent to 2 percent of the total — and the Middle Atlantic (Delaware, Maryland, New Jersey, New York, Pennsylvania) — down from 13 percent to 8 percent of the total (figure 14).
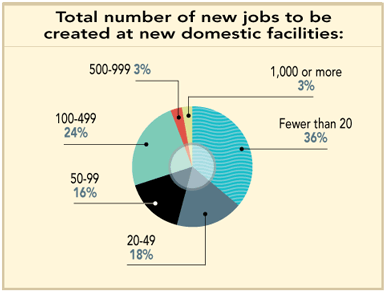
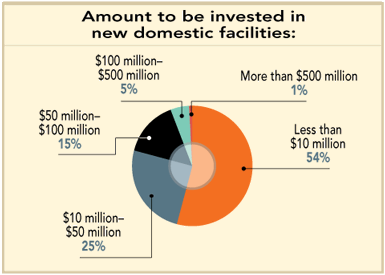
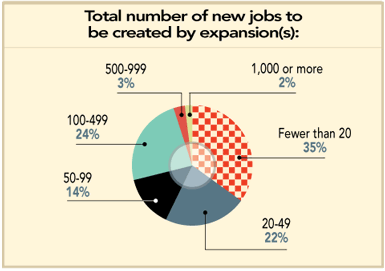
The majority of the new domestic facilities planned by the Corporate Survey respondents will be manufacturing operations (28 percent) and warehouse/distribution centers (23 percent) (figure 15). And only 30 percent of the respondents claim their new domestic facilities will create more than 100 jobs (figure 16). Investment figures are on the low end as well: more than half the respondents say less than $10 million will be invested in new domestic facilities (figure 17).
When it comes to Asia, China is a perennial favorite, accounting for 44 percent of the planned new Asian facilities. Interest in India has increased — up from 17 percent to 33 percent — as has interest in Malaysia, which jumped from 7 percent to 22 percent of the planned total new Asian facilities (figure 20).
A third of the new foreign facilities planned by the Corporate Survey respondents will house manufacturing operations, and 19 percent will be warehouse/distribution centers (figure 21). It also seems these respondents will create more jobs at foreign facilities than at domestic ones — 44 percent say their new foreign facilities will create more than 100 jobs (figure 22). Nevertheless, the total investment in new foreign facilities will be under $10 million for 42 percent of the respondents, with another 37 percent expecting that investment to be between $10 million and $50 million (figure 23).
Relocation plans are up slightly on a year-over-year basis. Thirty percent of the Corporate Survey respondents plan to relocate a domestic facility over the next three years (figure 26). Among the reasons cited for relocation are high taxes (44 percent) and excessive government regulations (29 percent), as well as labor availability (26 percent) and labor costs (24 percent) (figure 27).
Nevertheless, only 2 percent of the respondents expect to relocate a domestic facility to offshore (down from 7 percent claiming they would make such a move in the prior year’s survey). And, as for reshoring a facility back to the U.S., only 4 percent claim they would being making that move (figure 28) — consistent with the prior year’s results and despite all the media reports of a surge in the reshoring movement. Of those few who claim they will reshore, two thirds cite rising foreign labor costs as the impetus for doing so, and half say product quality issues and the costs of transporting supplies/products are to blame (figure 29). On the flip side, among the issues preventing our Corporate Survey respondents from spending more of their earnings on investment in U.S. facilities are, as in years past, excessive government regulation (56 percent), high corporate taxes/tax uncertainty (47 percent), economic instability (46 percent), and healthcare costs under the Affordable Care Act (37 percent) (figure 30).
Next: Corporate Respondents’ Location PrioritiesCorporate Respondents’ Location Priorities
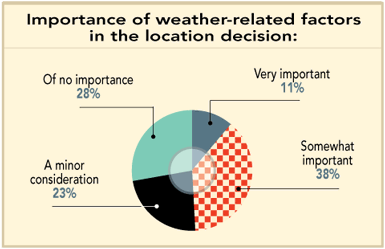
Corporate decision-makers take many site selection and quality-of-life factors into consideration when making plans for new facilities, expansions, and relocations. We therefore asked our survey-takers to rate these factors as either “very important,” “important,” “minor consideration,” or “of no importance.” Their ratings are show in figure 31. We then added the “very important” and “important” ratings in order to rank the factors in order of overall importance, as shown in figure 32.
The #1 site selection factor in the 29th Annual Corporate Survey is highway accessibility, rated “very important” or “important” by 88.3 percent of the respondents. This is no surprise considering the need to move products and people into and out of a facility. In fact, proximity to major markets is ranked #8 among the site selection factors, with a combined importance rating of 77.1 percent. The poor condition of the nation’s highway infrastructure adds to the concern about highway access (see: “Infrastructure Investment: The Bridge to Economic Growth.”).
In the prior year’s Corporate Survey, the respondents had ranked availability of skilled labor as the top location factor. This year, that factor slipped to #5 in the rankings, only considered “very important” or “important” by 82.1 percent of the respondents. Oddly enough, only 45 percent say availability of skilled labor is having an effect on their new facility/expansion plans (figure 33). Nonetheless, if we examine figure 31, we can see that availability of skilled labor is actually rated “very important” by 50 percent of the corporate respondents, ranking it second behind highway accessibility in the separate “very important” category. Additionally, two thirds of the respondents note workers are lacking advanced skills such as machine tool programming or bioprocessing (figure 34). And the training programs factor jumped from #23 to #18 in the rankings, increasing 11.3 percentage points (the biggest increase among the factors) and now considered “very important” or “important” by 62.8 percent of the Corporate Survey respondents. And although proximity to college/technical training still hovers in the lower half of the rankings at #20 this year, it did increase 7.4 percentage points with a combined importance rating of 61.5 percent.
The upward trending of occupancy and construction costs, available land, and available buildings — and downward trending of the labor costs factor — may be attributed to projects that were previously put on hold during the economic downturn being moved off the back burner now, according to Les Cranmer of Savills Studley (see his accompanying analysis). According to Cranmer, companies are now more focused on revenue growth than cost-cutting, as well as getting projects up and running quickly. In fact, more than 60 percent of the respondents say the existence of a pre-certified or shovel-ready site is very or somewhat important (figure 46).
The right-to-work (RTW) state factor is also in the top10 this year, up from its 11th place ranking in the prior year’s survey to #7 in the 29th Annual Corporate Survey and rated “very important” or “important” by 77.9 percent of the respondents. And although low union profile is only ranked #14 in the combined importance ratings, it is ranked #3 (just behind availability of skilled labor) if one considers just its “very important” rating of 48.8 percent.
It was previously noted that the Midwest region will garner most of the respondents’ new domestic facilities, and it’s interesting that two states in that region — Indiana and Michigan — have recently passed right-to-work legislation. Moreover, manufacturing employment is up in both of these states. Indiana, which passed RTW legislation in February 2012, saw an 8.9 percent jump in manufacturing employment from March 2012 to October 2014. And, in Michigan, which passed RTW a year after Indiana, manufacturing jobs were up by 3.3 percent from March 2013 to October 2014, representing the 11th highest nationwide gain.
Surprisingly, corporate tax rate and state and local incentives moved down in the rankings to the 10th and 11th spots, although each (along with tax exemptions, which tied and held its 11th position) are still considered “very important” or “important” by around three quarters of the respondents. Tax incentives are considered to be the most important type of incentives by 72 percent of those responding to the Corporate Survey (figure 40). And nearly three quarters of the respondents say that incentives are very or somewhat important to a project moving forward in a particular location (figure 41).
The site selection factor showing the biggest change is availability of advanced ICT services — dropping from #5 to #24 in the rankings and only considered “very important” or “important” by 45.1 percent of the Corporate Survey respondents. The only explanation I have for this is that these services are now so ubiquitous that they are taken for granted in almost every location.
The factor showing the second largest drop in its importance rating — down 11.7 percent points with a combined rating of 63.1 percent - is availability of long-term financing. This factor ranked #17 this year. With interest rates remaining low, this factor’s rating is not surprising.
Finally, as in years past, quality-of-life factors are ranked separately from site selection factors. Not surprisingly, low crime rate remains the #1 quality-of-life concern of the Corporate Survey respondents, receiving an 84.4 percent combined importance rating.
The quality-of-life factor showing the largest increase in importance — 8.8 percent points — is colleges and universities in area, ranking #6 among the quality-of-life factors with a 68.3 combined importance rating. This increase in importance points to the need for an educated and trained workforce. Ratings of public schools moved up two spots to #2 among the quality-of-life factors, with a 75.3 percent combined importance rating.
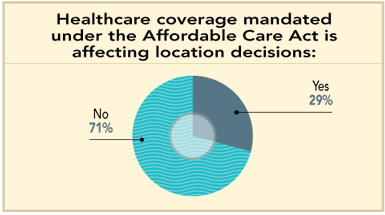
The healthcare facilities quality-of-life factor is ranked #3. However, 71 percent of the respondents say healthcare coverage mandates under the Affordable Care Act are not affecting their location decisions (figure 35). What will affect their location decisions, on the other hand, is legalization of marijuana. Nearly two thirds of the respondents believe the quality of the workforce will be negatively affected in states that are legalizing marijuana, and almost half of the Corporate Survey respondents say legalized marijuana laws will affect their decision to locate a facility in states with such laws on the books (figure 36).
Finally, it should be noted that none of the site selection or quality-of-life factors achieved a combined “very important” or “important” rating of 90 percent or greater. The respondents to our 29th Annual Corporate Survey seemed to have spread their priorities out among the factors.
Corporate Respondents’ Information Sources
Our corporate executive readers use many sources of information when making location decisions, but chief among these are site magazines like Area Development at 81 percent. Half also use general business and financial publications as sources of information.
Of the 69 percent of respondents who utilize the Internet in the site and facility planning process, nearly 80 percent are looking for data on specific locations; two thirds are seeking contact names; and more than half want to find available buildings and sites.
More than two thirds of the respondents to our 29th Annual Corporate Survey say that when making location decisions, they start the information-gathering process at least one to two years out and contact the locations of interest three to six months later. For more than 90 percent, between one and five locations make their “short list” and warrant a visit. Eighty-five percent of the respondents make a final location decision with three months to a year of contacting the locations of interest.
Fewer than half of the Corporate Survey respondents claim to use outside consultants when making location decisions. Those that do use the services of consultants employ them primarily to facilitate the real estate transaction (61 percent), perform location studies/comparative analyses (55 percent), and negotiate and manage the incentives process (47 percent).
Drawing Conclusions
Although economists project growth to continue in 2015, this year’s Corporate Survey respondents are still hesitant — 72 percent of them do not expect continuous economic growth until 2016 or 2017. Consequently, their location and expansion plans are not as robust as we had hoped. Perhaps their confidence will be bolstered by the fact that consumer spending, which accounts for more than two thirds of U.S. economic activity, advanced at a 4.3 percent pace in the fourth quarter of 2014 — the fastest since the first quarter of 2006, and up from 3.2 percent in 2014’s third quarter.
“The level of consumer sentiment supports our view that consumer spending will kick the year off on a robust foot after the drop in energy prices left consumers’ wallets full,” noted Bricklin Dwyer, an economist at BNP Paribas, New York, in a Reuters news release. But although the drop in oil prices is putting more money in consumers’ pockets and boosting their spending on other products, on the flip side, economists warn that energy-producing regions could suffer job losses.
Nonetheless, business investment in equipment has increased 8.6 percent over 2014 — more than double the 4.2 percent annual average from mid-2011 to mid-2013. Inventories have also increased at an annual rate of $75.3 billion, as compared to the $46.6 billion average increase for 2012 and 2013. And, most importantly, hiring is up. As stated in beginning of this piece, 2.9 million jobs were added from the December 2013 to December 2014 period. The number of job openings in the U.S. is at the highest level since 2001 and this should translate to increases in wages and even more spending on durable goods such as furniture, appliances, and vehicles. Notably, 16.4 million vehicles were sold in 2014, the highest volume since 2006.
“Over the long term, where the consumer goes, the economy goes,” concludes Michael Gap, chief U.S. economist at Barclays. If this upward economic trajectory continues, we expect our 30th Annual Corporate Survey to reveal more new facility and expansion activity to fulfill consumer demand.