
What’s more important, economists believe, are the positive effects of President Trump’s signature Tax Cuts and Jobs Act, which slashed the corporate tax rate down to 21 percent from 35 percent and should help to put U.S. businesses on a level playing field with their global competitors, spurring the U.S. economy to grow even further.
Jay Timmons, president and CEO of the National Association of Manufacturers (NAM), says that as a result of the tax cut, manufacturers will “increase capital spending, expand their businesses, and hire more workers.” He further predicts that “nearly half will increase employee wages and benefits.”
Early in his presidency, Trump signed an Executive Order to cut business regulations — another move applauded by industry. A June 2017 report from the Manhattan Institute delved into how regulations stifle business growth because of their inefficiencies and costs.
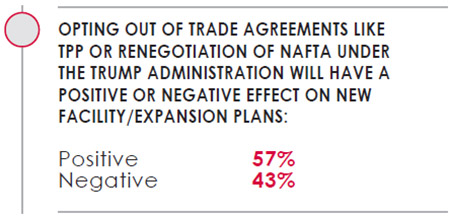
Another item on the President’s agenda is opting out of (e.g., TPP) — or renegotiating (e.g., NAFTA) — trade agreements that put the United States at a competitive disadvantage. In January 2018, President Trump told the World Economic Forum in Davos, “We support free trade, but it needs to be fair and reciprocal.”
Let’s look at the results of Area Development’s most recent surveys of our corporate executive readers, as well as the consultants to industry who serve them, in order to determine the effects of tax cuts, regulatory reform, and trade agreements on business executives’ upcoming site and facility plans and priorities. The answers from both groups of participants are somewhat surprising.
32nd Annual Corporate Survey Results
-
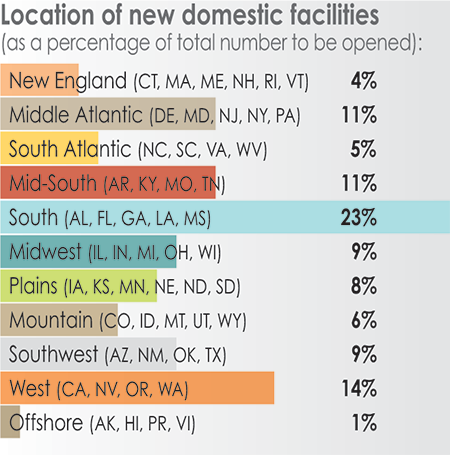
Chart 1

-
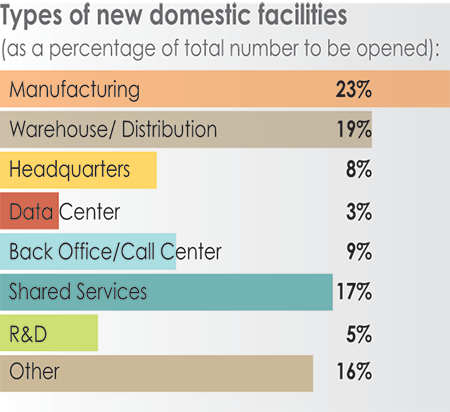
Chart 2
-
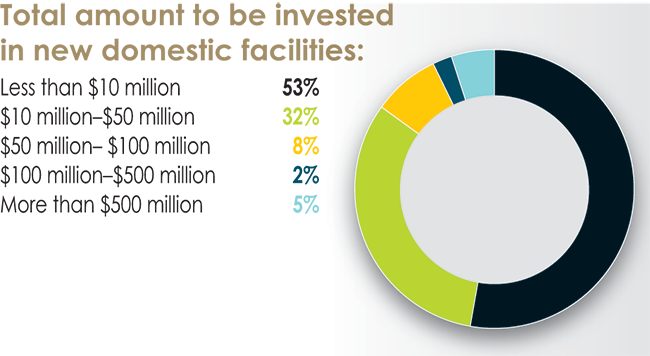
Chart 3
-
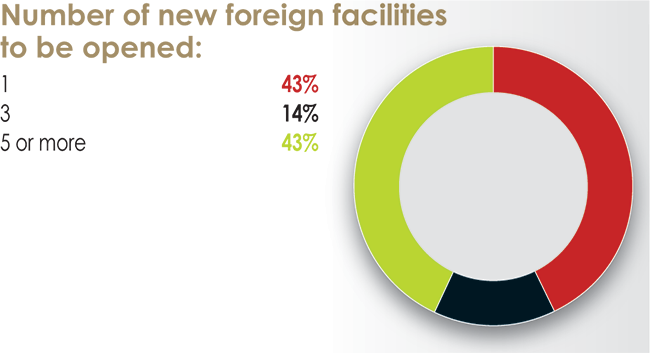
Chart 4
-
Chart 5
-
Chart 6
-
Chart 7
-
Chart 8
-
Chart 9
-
Chart 10
-
Chart 11
-
Chart 12
-
Chart 13
-
Chart 14
-
Chart 15
-
Chart 16
-
Chart 17
-
Chart 18
-
Chart 19
-
Chart 20
-
Chart 21
-
Chart 22
-
Chart 23
-
Chart 24
-
Chart 25
-
Chart 26
-
Chart 27
-
Chart 28
-
Chart 29
-
Chart 30
-
Chart 31
-
Chart 32
-
Chart 33
-
Chart 34
-
Chart 35
-
Chart 36
-
Chart 37
-
Chart 38
-
Chart 39
-
Chart 40
-
Chart 41
-
Chart 42
-
Chart 43
-
Chart 44
-
Chart 45
-
Chart 46
-
Chart 47
-
Chart 48
-
Chart 49
-
Chart 50
-
Chart 51
-
Chart 52
-
Chart 53
-
Chart 54
-
Chart 55
-
Chart 56
-
Chart 57

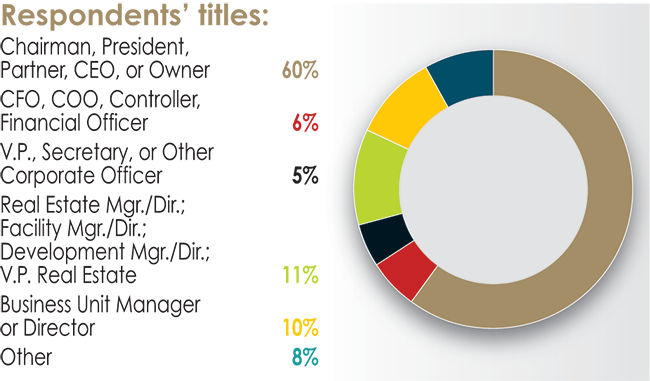
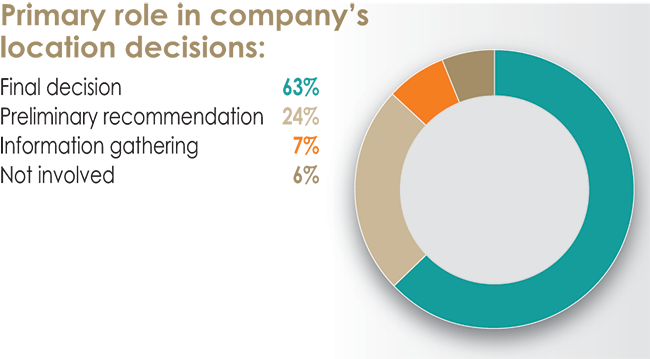
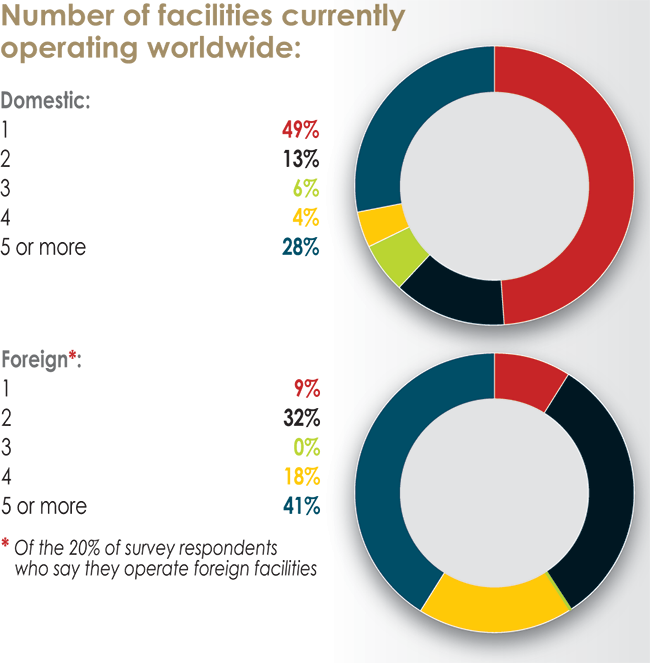
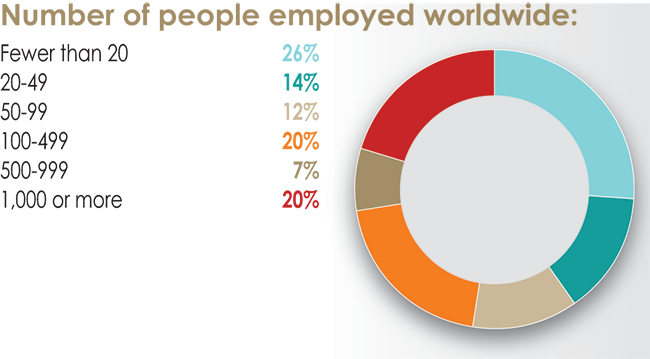


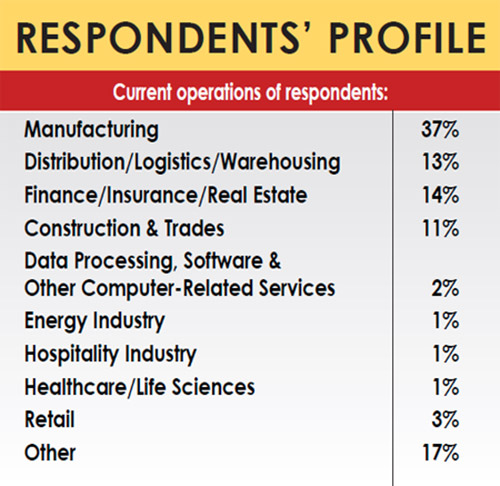
Half of the respondents to our Corporate Survey are with manufacturing (37 percent) or distribution/logistics/warehousing (13 percent) firms. Sixty percent are the owners or top executive of these firms and are responsible for their companies’ final location decision. About half are with firms employing fewer than 100 workers, and only 20 percent operate foreign facilities. Keeping that in mind, it’s interesting to note their responses when asked about recent tax and legislative reforms under the Trump administration.
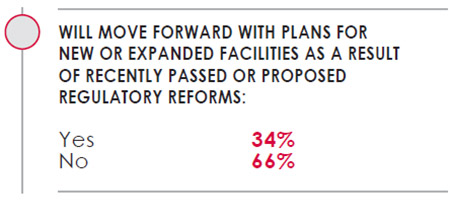
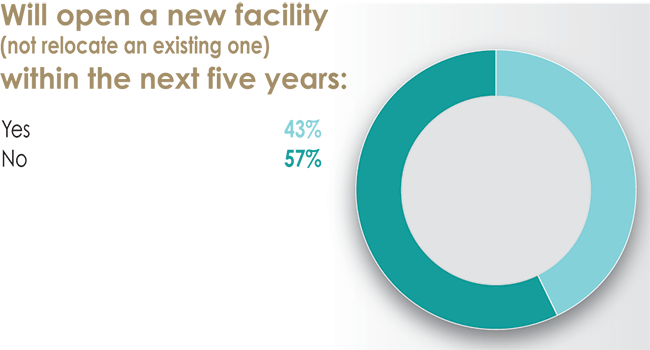
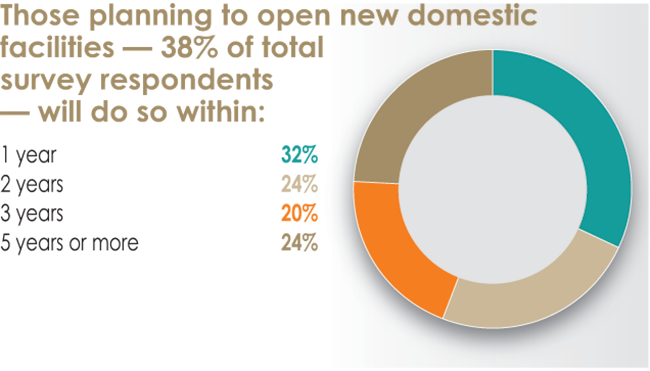
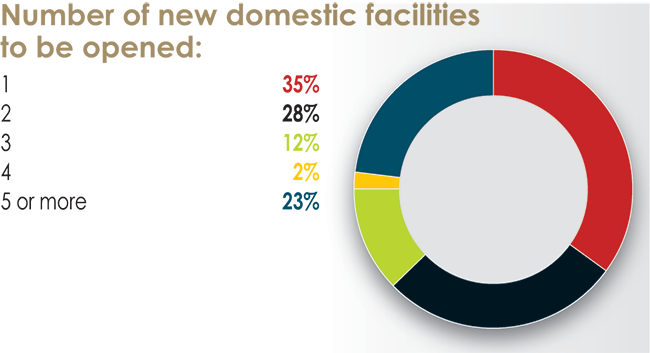
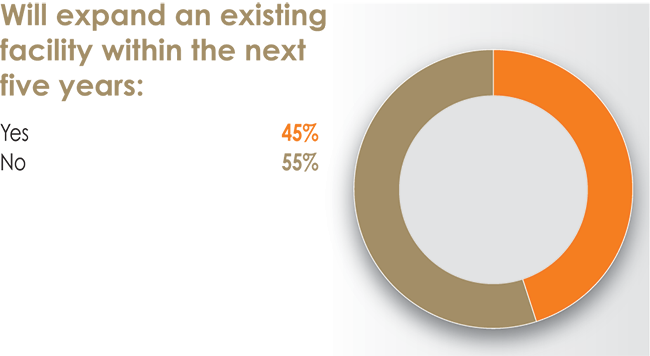
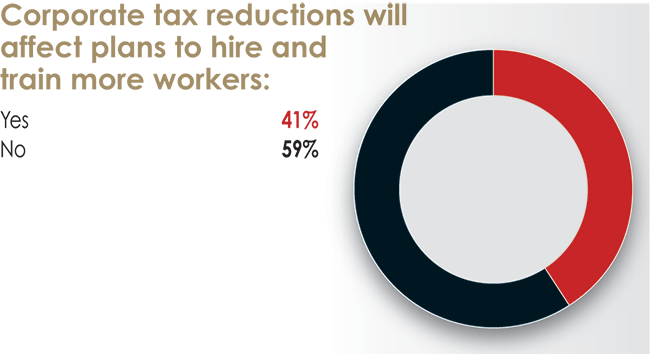
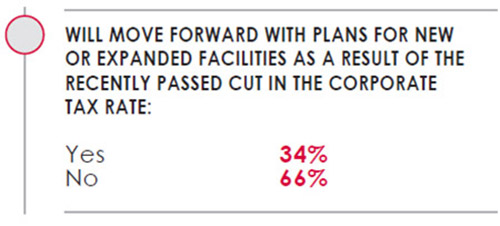
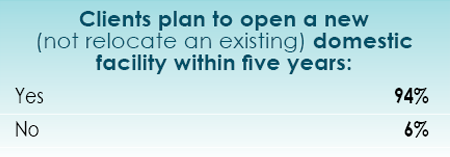
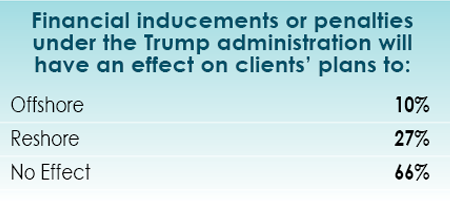
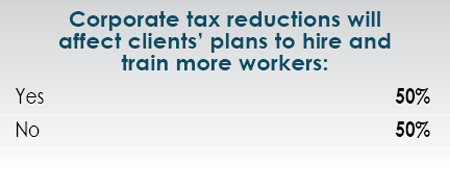
Although nearly half of the respondents to our Corporate Survey say they have plans to open a new facility within the next five years (43 percent) or expand an existing facility within the next five years (45 percent), only a third of the respondents claim a cut in the corporate tax rate will cause them to move forward with plans for new or expanded facilities. Similarly, only a third say they will move forward with new facility or expansion plans as a result of recently passed or proposed regulatory reforms. The respondents are, however, more enthusiastic about opting out of trade agreements like TPP or renegotiating trade agreements like NAFTA: 57 percent say these moves will have a positive effect on their plans for new or expanded facilities. Perhaps these respondents agree that current trade agreements have put U.S. businesses at a disadvantage to their foreign competitors — especially for smaller-sized, primarily domestic firms like those represented by these corporate respondents.
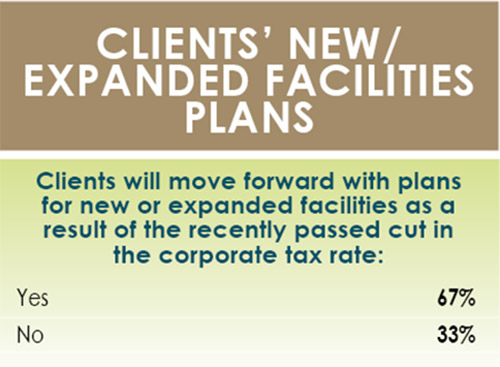
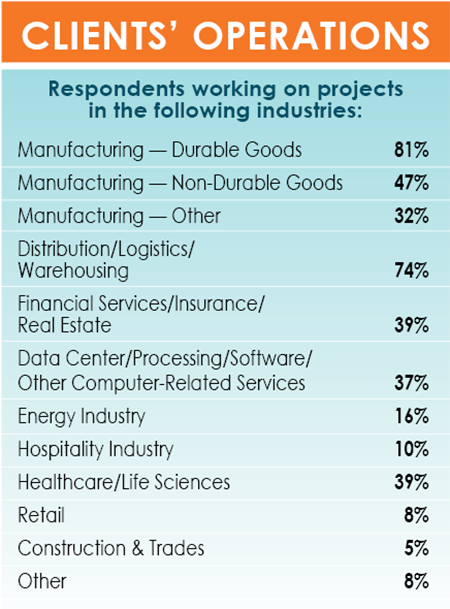
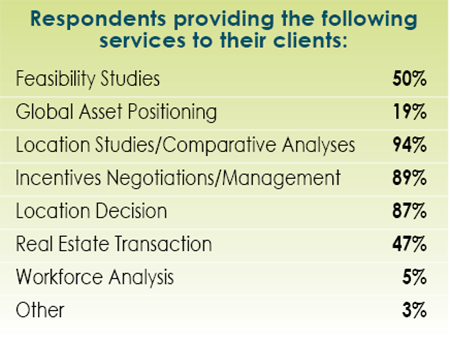
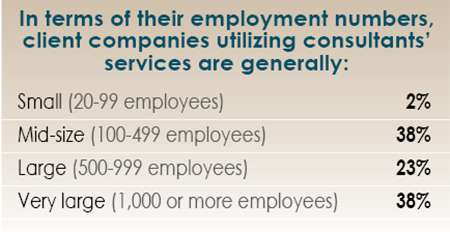
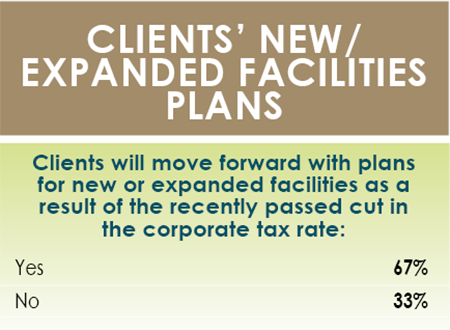
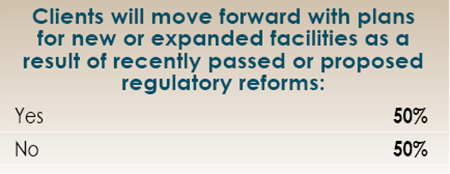
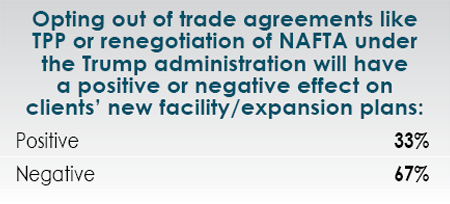
The respondents to our Consultants Survey provide a counterpoint to the Corporate Survey responses. About 80 percent of the responding consultants work with durable goods manufacturers, with 60 percent saying they work with large-sized firms (500 to 1,000-plus employees). Two thirds of the responding consultants believe their clients will move forward with plans for new or expanded facilities as a result of cuts in the corporate tax rate, and 50 percent say recently passed or proposed regulatory reforms will also spur their clients’ planned new facility or expansion moves. And, importantly, 67 percent believe opting out of or renegotiating trade agreements will have a negative effect on their clients’ plans.
The difference between the corporate executives’ and consultants’ outlooks on tax and legislative changes may be due to the sizes of the consultants’ client companies. Larger companies tend to have global operations and would be put at a disadvantage if their foreign-sourced goods or parts were subject to high tariffs. (Consider large automakers’ multinational supply chains.)
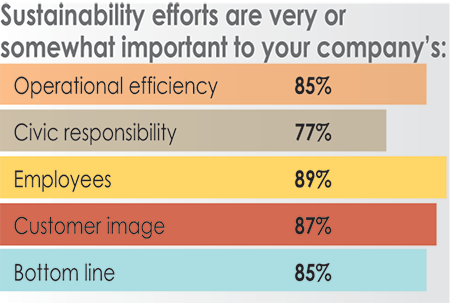
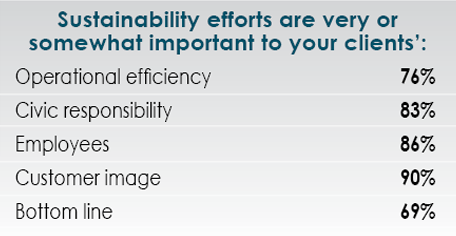
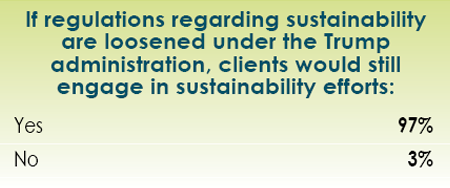
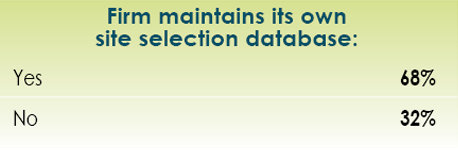
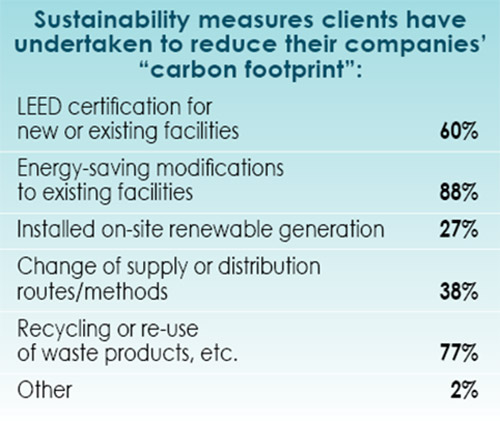
Importantly, when examining the results of both the Corporate and Consultants surveys, one should also keep in mind that only 32 percent of the respondents to the Corporate Survey say they use the services of consultants for their site and facility planning needs. Nonetheless, the corporate and consultant respondents are pretty much in agreement when it comes to sustainability efforts. Even if regulations regarding sustainability are loosened under the Trump administration, 83 percent of the Corporate Survey respondents say their companies would still engage in sustainability efforts, and 97 percent of the Consultants Survey respondents say their client companies would do the same. Both groups consider sustainability efforts important to a company’s operational efficiency, employees, civic responsibility, and customer image — and ultimately its bottom line.
Survey Respondents’ Workforce Concerns
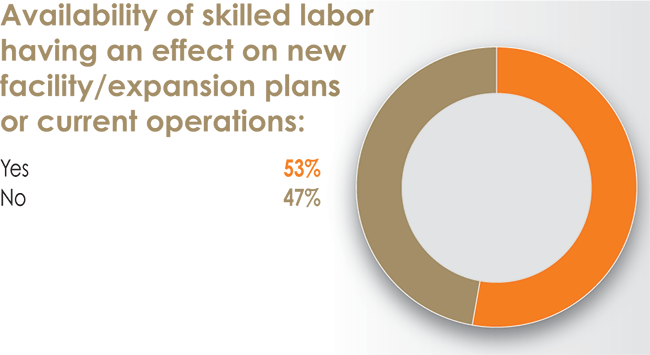
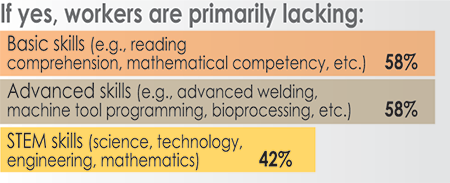
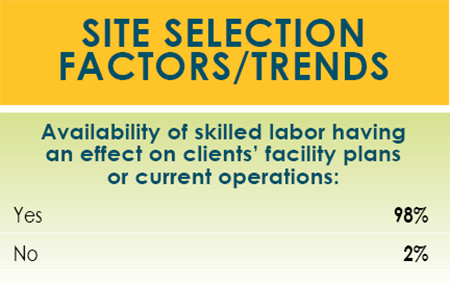
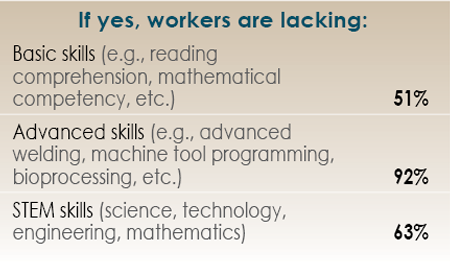
With the unemployment rate reaching 4.1 percent in January, we would think availability of labor, especially skilled labor, would be our Corporate Survey respondents’ primary concern. However, just slightly more than half of the respondents (53 percent) say availability of skilled labor is having an effect on their new facility or expansion plans — or even their current operations. Of those, nearly 60 percent say workers are missing basic (reading, math, etc.) as well as advanced skills (advanced welding, machine tool programming, etc.)
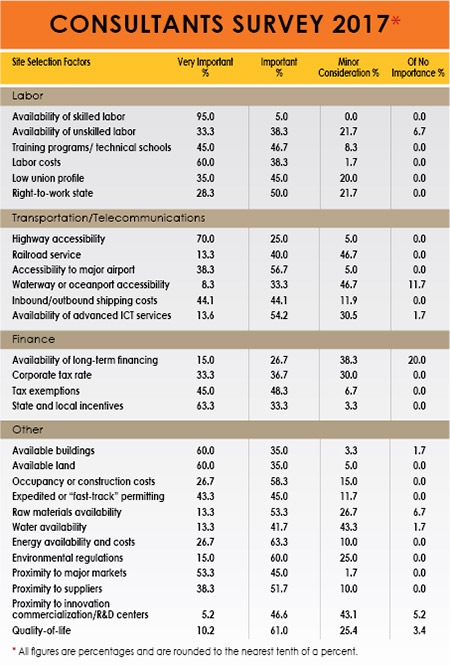
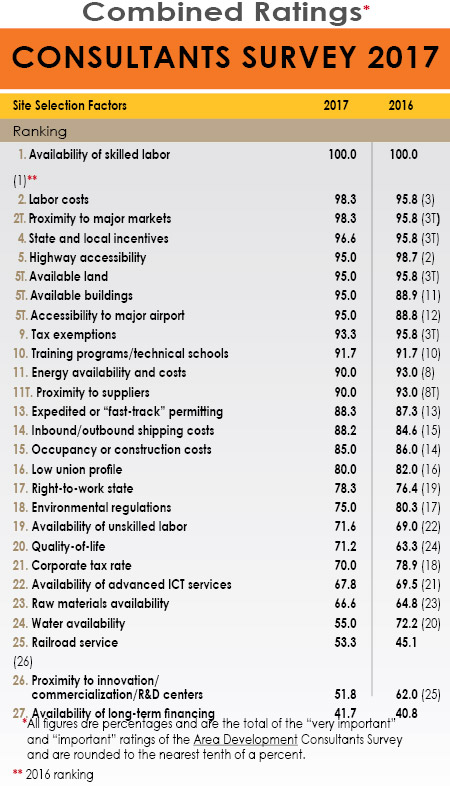
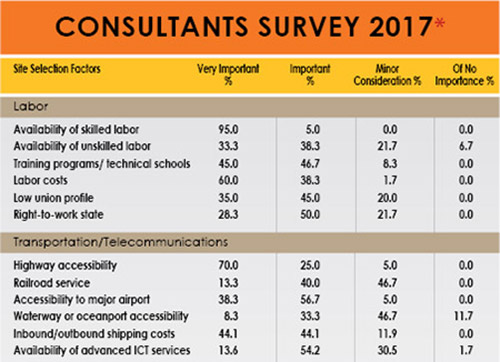
When ranking the site selection factors, the Corporate Survey respondents placed availability of skilled labor in the #3 spot, considered “very important” or “important” by 88.8 percent. In comparison to this, 100 percent of the respondents to our Consultants Survey rated availability of skilled labor as “very important” or “important,” ranking this criterion #1 among the site selection factors. Additionally, nearly all (98 percent) of the responding consultants say availability of skilled labor is affecting their clients’ facilities plans or current operations, and a lack of advanced skills was cited by 92 percent of the consultants.

The corporate respondents are, however, concerned about raises to the minimum wage: 60 percent say these increases will affect their current operations, and 55 percent say the hikes will also affect plans to add employees. And both the Corporate and Consultants Survey respondents rank labor costs as the #2 site selection factor.
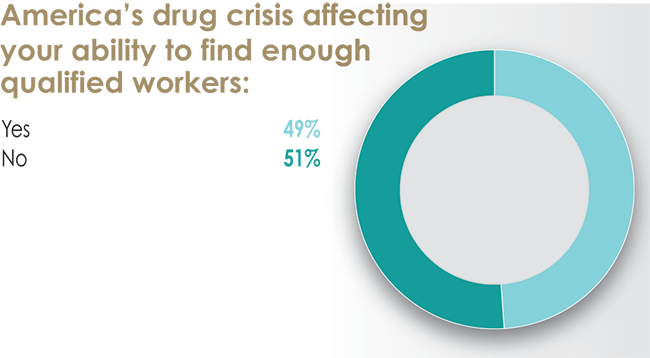
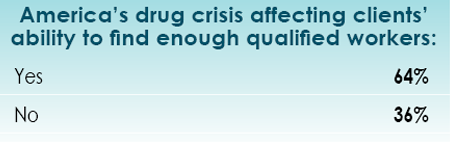
America’s opioid drug crisis is another top concern, yet the two groups of survey respondents differ when it comes to the effect of this crisis on the workforce. Only about half of the Corporate Survey respondents say it is having an effect on their ability to find enough qualified workers, whereas nearly two thirds of the Consultants Survey respondents claim the crisis is affecting their clients’ ability to do the same.
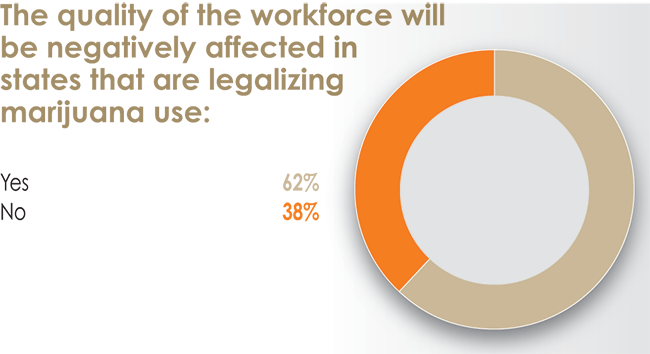
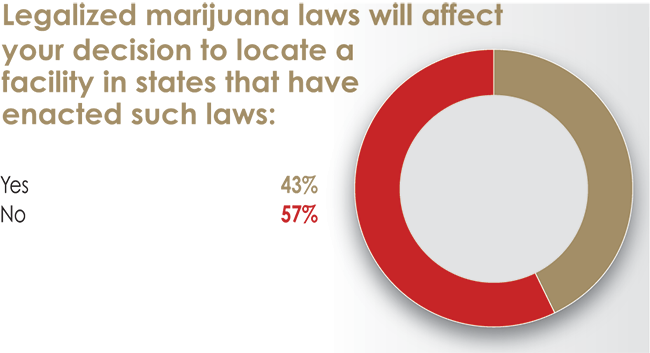
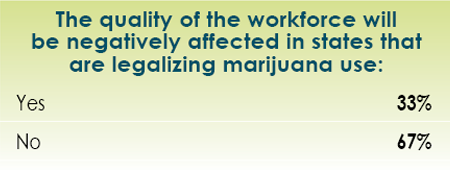
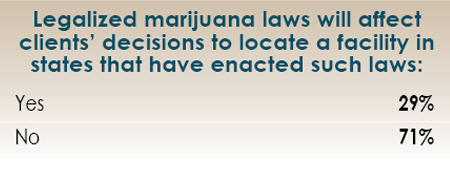
However, the consultants are much less concerned about the effects of legalized marijuana on the workforce. Two thirds of the consultants say it will not negatively affect the quality of the work force, and 71 percent say legalized marijuana laws will not affect their clients’ decisions to locate a facility in states that have enacted such laws. More than 60 percent of the Corporate Survey respondents say legalized marijuana will affect the quality of the workforce, and 43 percent say it would affect their decision to locate in a state that has enacted legalization of marijuana.
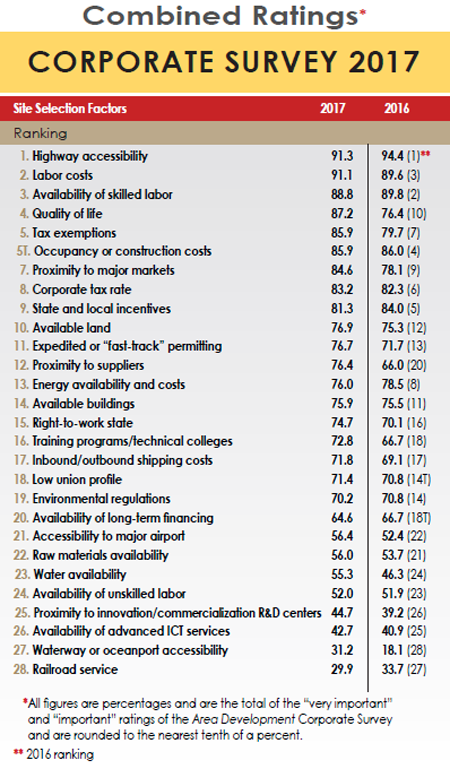
In fact, the Corporate Survey respondents are very concerned with quality of life. They ranked this factor #4, with an 87.2 combined importance rating. On the other hand, the respondents to our Consultants Survey, only placed quality of life in the #20 spot among the site selection factors, with a 71.2 combined importance rating.
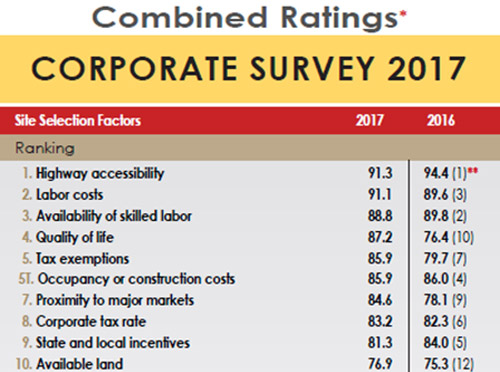
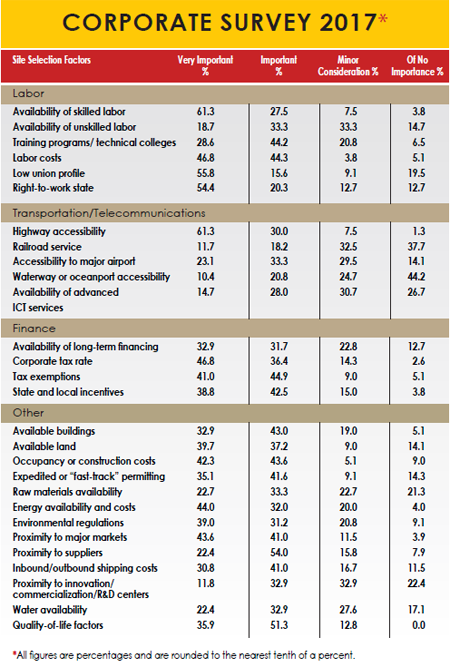
Twelve of the site selection factors actually received a combined “very important” or “important” rating of 90 percent or more from the respondents to the Consultants Survey. Among these are the related factors of highway accessibility and proximity to markets and suppliers, as well as available land and buildings and access to an airport to fly top executives — and their consultants — in and out. For the Corporate Survey respondents, highway accessibility is the #1 factor, considered “very important” or “important” by 91.3 percent. And, interestingly, only 56.4 percent think access to a major airport is critical.
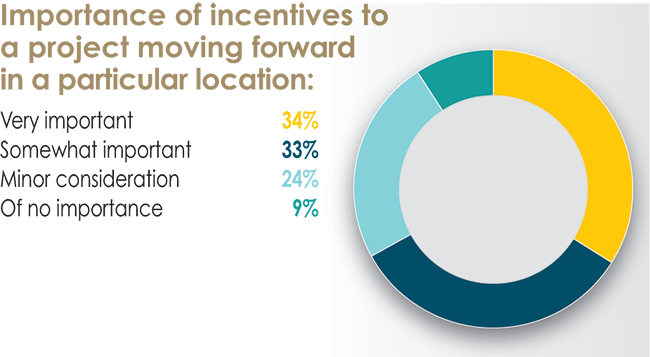
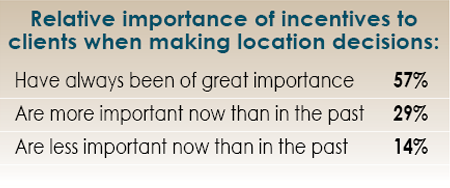
As expected, the responding consultants believe state and local incentives (#4 among the factors with a 96.6 percent importance rating) and tax exemptions (#9 among the factors with a 93.3 percent importance rating) are critical site selection criteria. Although the Corporate Survey respondents don’t rate or rank these factors as highly, they are still prominent — tax exemptions placed #5 (85.9 percent) and state and local incentives took the #9 spot with an 81.3 percent combined importance rating. And two thirds of the Corporate Survey respondents say incentives are very or somewhat important to a project moving forward.
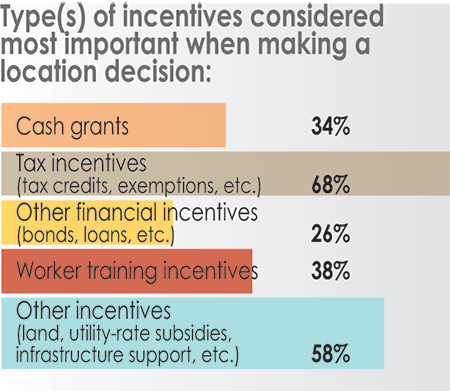
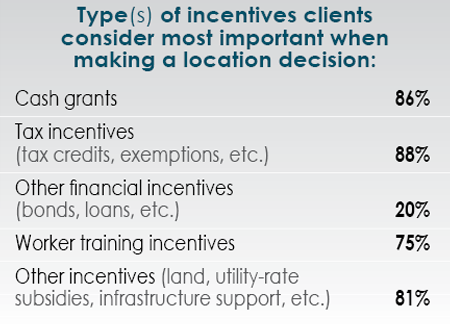
When it comes to types of incentives, more than 85 percent of the consultants say their clients believe cash grants as well as tax incentives to be most important. Two thirds of the Corporate Survey respondents consider tax incentives most important, but only a third give cash grants prominence.
14th Annual Consultants Survey Results
-
Chart 1
-
Chart 2
-
Chart 3
-
Chart 4
-
Chart 5
-
Chart 6
-
Chart 7
-
Chart 8
-
Chart 9
-
Chart 10
-
Chart 11
-
Chart 12
-
Chart 13
-
Chart 14
-
Chart 15
-
Chart 16
-
Chart 17
-
Chart 18
-
Chart 19
-
Chart 20
-
Chart 21
-
Chart 22
-
Chart 23
-
Chart 24
-
Chart 25
-
Chart 26
-
Chart 27
-
Chart 28
-
Chart 29
-
Chart 30
-
Chart 31
-
Chart 32
-
Chart 33
-
Chart 34
-
Chart 35
-
Chart 36
-
Chart 37
-
Chart 38
-
Chart 39
-
Chart 40
-
Chart 41
-
Chart 42
-
Chart 43
-
Chart 44
-
Chart 45
-
Chart 46
-
Chart 47
-
Chart 48
-
Chart 49
-
Chart 50
-
Chart 51
-
Chart 52
-
Chart 53
-
Chart 54
-
Chart 55
-
Chart 56


Manufacturers’ optimism, as reflected in NAM’s Q4/2017 Manufacturers’ Outlook Survey, is at a 20-year high. NAM CEO Jay Timmons notes this “is a direct result of manufacturers witnessing a sea change in policymaking in Washington, D.C., empowering them to hire more, invest more, and build more — all in America.” The respondents to Area Development’s Consultants Survey would agree with the scope of these projections and the rationale behind them; however, the results of our Corporate Survey of our readers do not reflect a direct correlation between investment and hiring plans and the recent tax and legislative changes.
As we move further into 2018, it’s hoped that any hesitancy in 2018 investment decisions resulting from this challenge can be overcome. However, as Willy Shih, a manufacturing expert and professor at Harvard Business School recently told IndustryWeek, decisions to build new plants in the U.S. or reshore operations won’t materialize overnight.