With shipping volumes up, supply chain strategists are increasingly motivated by quality seaport flexibility, connectivity and cost. Recently, though, the West Coast market's lock on seaport supremacy has been somewhat diminished. Though Western seaports still remain active, concerns over supply chain disruptions have turned focus toward the East Coast. According to JLL’s proprietary Seaport Index, West Coast seaports volumes were 6.8 percent below 2007 peak levels, while shipping volumes on the East Coast topped 19.1 percent. Along with this increasing volume in consumer goods, of course, comes new demand for warehouse space to house it.

The top three seaports are all prioritizing infrastructure improvements, which can be linked to more active tenant requirements.
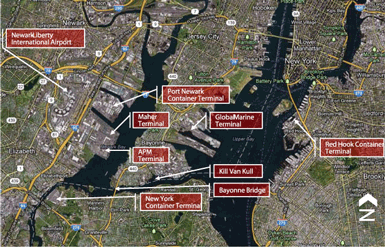
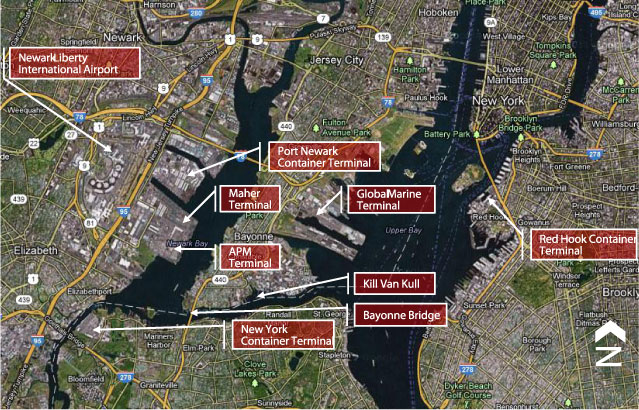
- The Port of New York/New Jersey topped JLL’s Index for the third consecutive year. Post-Panamax preparations are almost complete, and new redevelopment of its 70-acre terminal could more than double terminal capacity. Meanwhile, developers are taking note, with active construction totaling 3.6 million square feet. The availability for Class A and Class B space has been tight, driving rents up and absorptions higher.
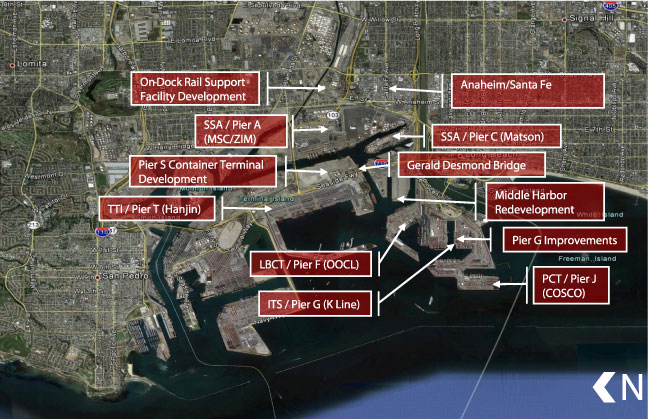
- The Port of Long Beach placed second in the index, committing $4.5 billion in capital improvements over the next decade to update terminals, roads, bridges and other infrastructures. The market's industrial fundamentals are simultaneously seeing lower vacancy rates and positive net absorption, while 3.1 million square feet of industrial product are currently under construction.
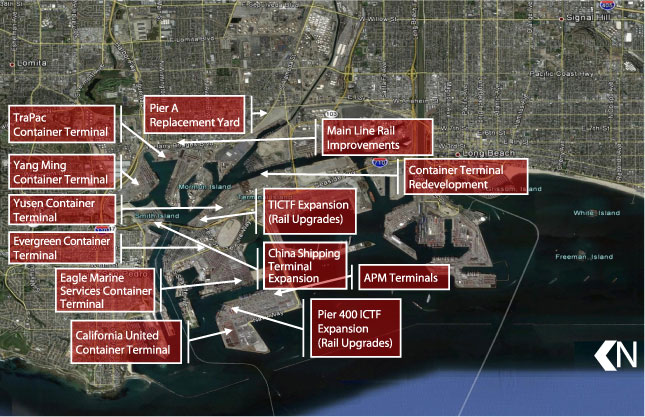
- Los Angeles, where roughly 40 percent of imports to the port will remain in the local 18.4 million-people market, terminal expansion, intermodal development, and other capital improvements are underway with approximately $1.1 billion invested. Significant leasing activity and increased demand for warehouse space is improving the market's landlord-favorable status.
The PAGI score was created to provide a quick snapshot of U.S. seaports from the vantage point of the real estate stakeholder, those who invest in, develop or occupy industrial property in port-centric locations.
The index was based on 25 measurable performance metrics, divided into two major categories: terminal operating factors and the corresponding real estate market factors. The resulting index score is then a combination of the performance indicators, providing a subjective measure of a port’s value to JLL clients and their customers.
The real estate metrics taken into consideration include the total amount of industrial real estate stock, the age of the inventory, vacancy rates and availability of suitable blocks of space within five, 15 and 50 miles of each port. The highest real estate scores go to the ports which have a healthy supply of modern stock and with still plenty of options for port-related users to lease or buy. This year, the highest score belongs to New York / New Jersey with its dense and dynamic markets just a short drive from the terminals. The Ports of Long Beach and Los Angeles followed, and the divide was notable since the counts of available, larger blocks of space were less. Together, the three ports are well ahead of their closest competitors.
The terminal operating metrics are designed to capture the health and growth of the ports as well as their functionality and connectivity. These measures quantify the total volume of containers, short- and long-term growth in volume, rail connectivity, labor flexibility, lines of service and post-Panamax readiness. The winner in this category is the Port of Long Beach due to its very large and quickly growing container volume, its rail connectivity and post-Panamax readiness. On the latter point, Long Beach is already handling container ships too large to pass through an expanded Panama Canal. Los Angeles is second while New York / New Jersey, Tacoma and Virginia round out the top five.
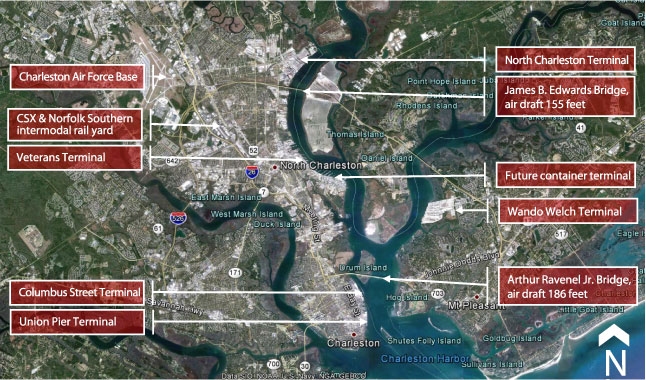
To produce the final JLL Seaport Index score, the two components are weighted then combined. This year’s highest ranked port is New York / New Jersey at 117.8. Long Beach and Los Angeles follow with scores of 112.1 and 103.4, respectively. The remaining ports fall neatly into two distinct tier groups. A handful of those in the second and third tiers are garnering sizeable attention through ongoing infrastructure initiatives and have the potential to move up in JLL’s rankings once projects comes to fruition. In the case of Charleston, for instance, the port offers strong rail connectivity, access to Western European markets and is supported by Charlotte and Charleston, two up-and-coming industrial corridors.