Subscribe
Close
  • Free for qualified executives and consultants to industry

  • Receive quarterly issues of Area Development Magazine and special market report and directory issues

Renew

30th Annual Survey of Corporate Executives: Cautious Optimism Reflected

New facility and expansion plans are up slightly on a year-over-year basis, although finding skilled labor is once again top of mind. Nearly half the respondents believe the U.S. economy is on a continuous growth track.

Q1 2016
As 2016 began, the global economy decelerated, oil prices sank, and the stock market plunged. Nonetheless, President Obama painted a rosy picture of the U.S. economy in his State of the Union address based on hiring numbers of the last two years, which were the best since the late 1990s. The Labor Department reported payrolls increased by 292,000 jobs in December 2015 alone, although most of these jobs are in the services sector. The optimists are hoping that an increase in hiring will lead to an increase in spending and, in turn, bump up economic growth, which is actually more dependent on the manufacturing and energy sectors and registered less than 1 percent in 2015’s final quarter.

Mark Zandi, chief economist at Moody’s Analytics, commented on the remarkable consistency of employment growth over the last several years. And optimism about employment actually led the Federal Reserve to raise interest rates for the first time since 2008. However, Carl Tannenbaum, chief economist at Northern Trust, told The New York Times (1/8/16), “We certainly see the impact of global conditions in the manufacturing sector, where the strong dollar and weak commodities prices have diminished momentum substantially [although] the service side of the American economy is progressing unabated.”

PwC’s Q4 2015 Manufacturing Barometer indicates U.S. manufacturers are being cautious in their hiring and capital spending plans because of the uncertain global economic outlook. They still anticipate revenue growth, but at a more modest pace. Do our corporate executive readers’ plans reflect this tempered optimism?
Slideshow30th Annual Corporate Survey Results 30th Annual Corporate Survey Results
Close

30th Annual Corporate Survey Results

  • Figure 1

    30th Annual Corporate Survey Results - Figure 1
  • Figure 2

    30th Annual Corporate Survey Results - Figure 2
  • Figure 3

    30th Annual Corporate Survey Results - Figure 3
  • Figure 4

    30th Annual Corporate Survey Results - Figure 4
  • Figure 5

    30th Annual Corporate Survey Results - Figure 5
  • Figure 6

    30th Annual Corporate Survey Results - Figure 6
  • Figure 7

    30th Annual Corporate Survey Results - Figure 7
  • Figure 8

    30th Annual Corporate Survey Results - Figure 8
  • Figure 9

    30th Annual Corporate Survey Results - Figure 9
  • Figure 10

    30th Annual Corporate Survey Results - Figure 10
  • Figure 11

    30th Annual Corporate Survey Results - Figure 11
  • Figure 12

    30th Annual Corporate Survey Results - Figure 12
  • Figure 13

    30th Annual Corporate Survey Results - Figure 13
  • Figure 14

    30th Annual Corporate Survey Results - Figure 14
  • Figure 15

    30th Annual Corporate Survey Results - Figure 15
  • Figure 16

    30th Annual Corporate Survey Results - Figure 16
  • Figure 17

    30th Annual Corporate Survey Results - Figure 17
  • Figure 18

    30th Annual Corporate Survey Results - Figure 18
  • Figure 19

    30th Annual Corporate Survey Results - Figure 19
  • Figure 20

    30th Annual Corporate Survey Results - Figure 20
  • Figure 21

    30th Annual Corporate Survey Results - Figure 21
  • Figure 22

    30th Annual Corporate Survey Results - Figure 22
  • Figure 23

    30th Annual Corporate Survey Results - Figure 23
  • Figure 24

    30th Annual Corporate Survey Results - Figure 24
  • Figure 25

    30th Annual Corporate Survey Results - Figure 25
  • Figure 26

    30th Annual Corporate Survey Results - Figure 26
  • Figure 27

    30th Annual Corporate Survey Results - Figure 27
  • Figure 28

    30th Annual Corporate Survey Results - Figure 28
  • Figure 29

    30th Annual Corporate Survey Results - Figure 29
  • Figure 30

    30th Annual Corporate Survey Results - Figure 30
  • Figure 31

    30th Annual Corporate Survey Results - Figure 31
  • Figure 32

    30th Annual Corporate Survey Results - Figure 32
  • Figure 33

    30th Annual Corporate Survey Results - Figure 33
  • Figure 34

    30th Annual Corporate Survey Results - Figure 34
  • Figure 35

    30th Annual Corporate Survey Results - Figure 35
  • Figure 36

    30th Annual Corporate Survey Results - Figure 36
  • Figure 36a

    30th Annual Corporate Survey Results - Figure 36a
  • Figure 37

    30th Annual Corporate Survey Results - Figure 37
  • Figure 38

    30th Annual Corporate Survey Results - Figure 38
  • Figure 39

    30th Annual Corporate Survey Results - Figure 39
  • Figure 40

    30th Annual Corporate Survey Results - Figure 40
  • Figure 41

    30th Annual Corporate Survey Results - Figure 41
  • Figure 42

    30th Annual Corporate Survey Results - Figure 42
  • Figure 43

    30th Annual Corporate Survey Results - Figure 43
  • Figure 44

    30th Annual Corporate Survey Results - Figure 44
  • Figure 45

    30th Annual Corporate Survey Results - Figure 45
  • Figure 46

    30th Annual Corporate Survey Results - Figure 46
  • Figure 47

    30th Annual Corporate Survey Results - Figure 47
Total number of new jobs to be created by domestic expansion(s).
Each year at this time — for 30 years, in fact — Area Development polls its readers to gauge their take on the economy as revealed by their location and expansion plans and site selection priorities. Let’s take a look at their responses to our Annual Corporate Survey to see if they align with the expectations expressed elsewhere.
Expand Figure 36a: The 30-Year comparison of the rating of the site selection factors
Close Figure 36a: The 30-Year comparison of the rating of the site selection factors
The 30-Year comparison of the rating of the site selection factors reveals some interesting trends: First, as the importance of skilled labor has increased over the years, the concern about labor costs has decreased in importance, while training programs have increased in importance. And as skilled labor has increased in importance, so has the emphasis on quality of life in order to attract that labor. Additionally, over the last five years, highway accessibility appears to have slipped in importance to the number-two spot. This may be due to the composition of the respondent pool, which was made up of only 35 percent manufacturers in 2015.
Respondent Profile
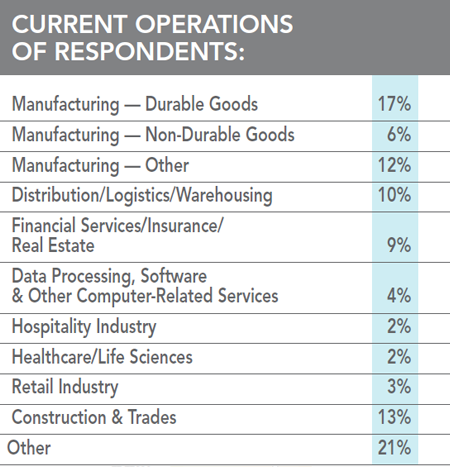
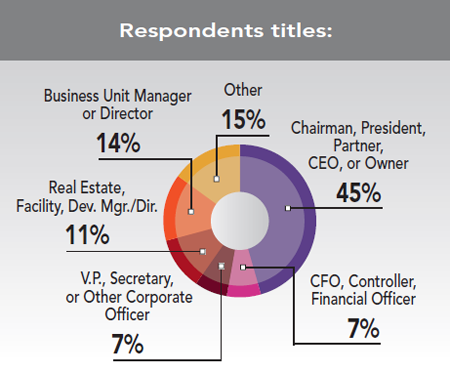
Of those responding to our 30th Annual Corporate Survey, just 35 percent are with manufacturing firms. Nearly 60 percent of these respondents represent the C-suite, i.e., they’re the owners or CEOs, CFOs, or other corporate officers.

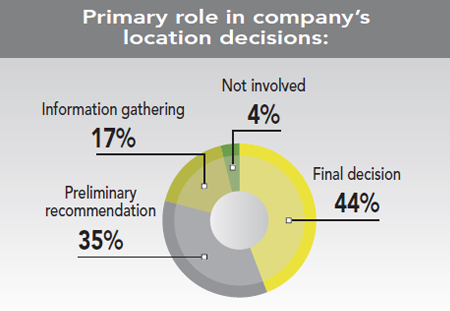
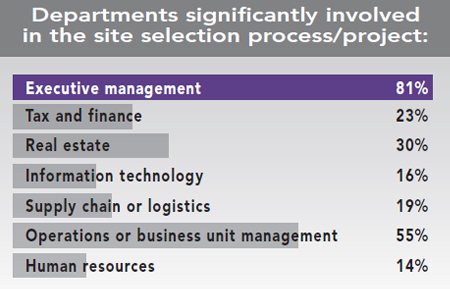
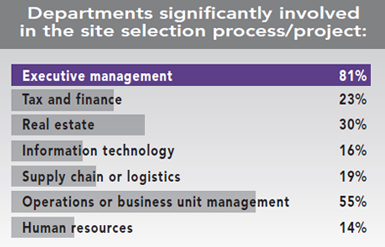
More than three quarters of these respondents make either the final location decision or the preliminary recommendation of where to locate or expand. It stands to reason, therefore, that 80 percent of the corporate respondents say executive management is significantly involved in the site selection process; and it’s no surprise that more than half say management of their operations or business units are also involved in this decision.

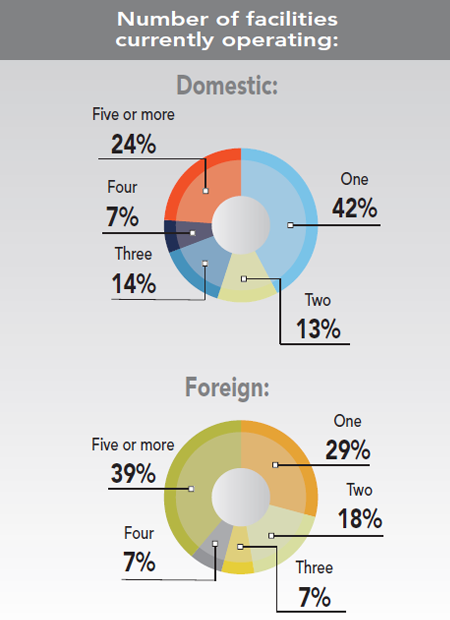
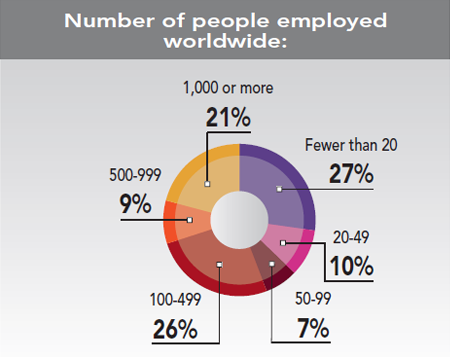
More than 40 percent of the Corporate Survey respondents operate just one domestic facility, with about a quarter operating five or more domestic facilities. The percentages are reversed when it comes to foreign facilities: just 29 percent of the respondents operate one foreign facility, while nearly 40 percent operate five or more. Thirty percent of the respondents employ 500 to 1,000+ people at their facilities worldwide, and 26 percent claim to be mid-sized in terms of employment (100-499 workers worldwide).

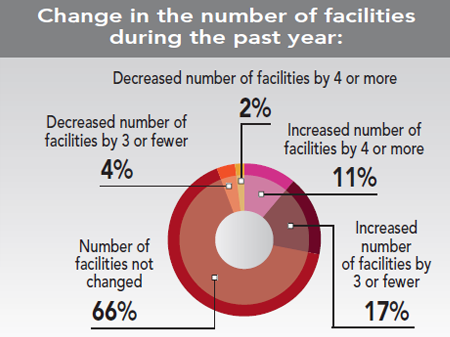
Fully two-thirds of this year’s Corporate Survey respondents say their number of facilities has not changed over the past year. However, 28 percent did increase their number of facilities, with only 6 percent claiming a decrease (these are the same percentages as reported in our prior year’s survey).
Figure 4: Departments significantly involved in the site selection process / project
Figure 4: Departments significantly involved in the site selection process / project.
The Corporate Survey respondents are, however, more bullish on the economy than they were last year. Nearly half (48 percent) say they believe the U.S. economy is on a continuous growth track. Only 39 percent held that opinion in the prior year’s survey.

New Facilities Plans
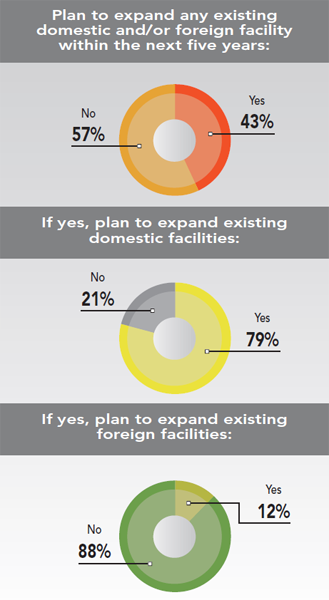
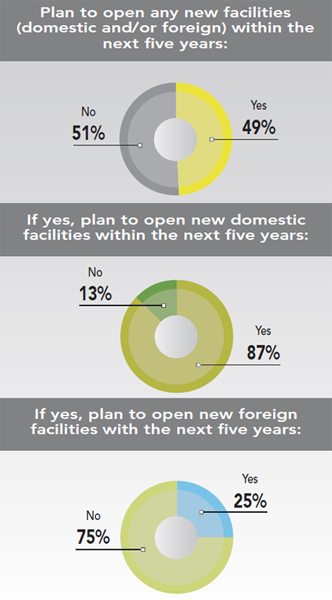
Some 49 percent of those responding to our Corporate Survey say they plan to open new facilities within the next five years (a 3 percent increase over the prior year’s survey). Of those, 87 percent say these facilities will be in the U.S., and just a quarter plan on locating these new facilities in a foreign location.

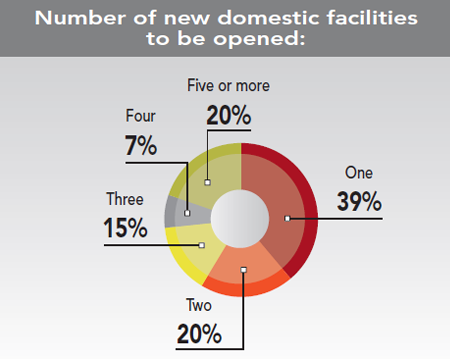
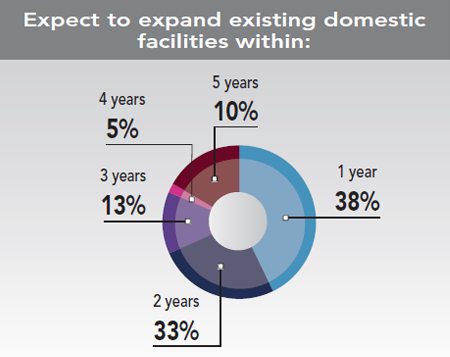
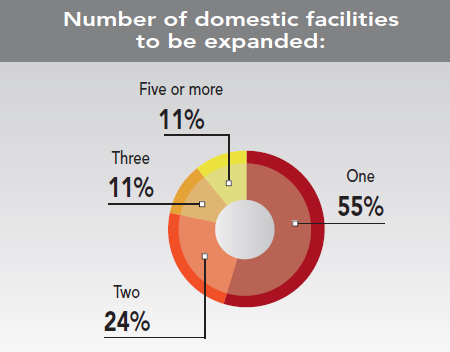
Nearly 70 percent of those with plans for new domestic facilities say they will open them within the next two years. Nearly 60 percent say they’ll open one or two domestic facilities, but a fifth say they’ll open five or more.


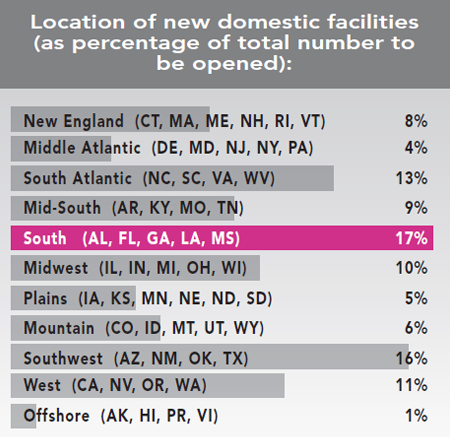
More than half of these new facilities will be in a southern region of the U.S. — 17 percent of the total planned projects are slated for the South; 16 percent for the Southwest; 13 percent for the South Atlantic; and 9 percent for the Mid-South. Whereas the prior year’s Corporate Survey respondents had planned 20 percent of their new facilities for the Midwest, the respondents to the 30th Annual Corporate Survey say only 10 percent of their new facilities are slated for that region of the U.S.
Figure 9: Plan to open any new facilities (domestic or foreign) within the next five years
Plans for the types of new domestic facilities to be opened did not change much year over year: 29 percent of the respondents’ total planned new domestic facilities will house manufacturing operations, 22 percent will serve as warehouse/distribution facilities, and 8 percent represent new headquarters projects.

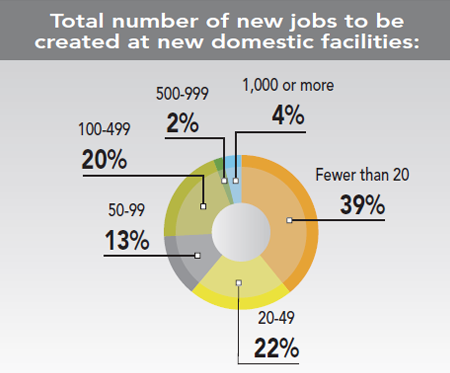
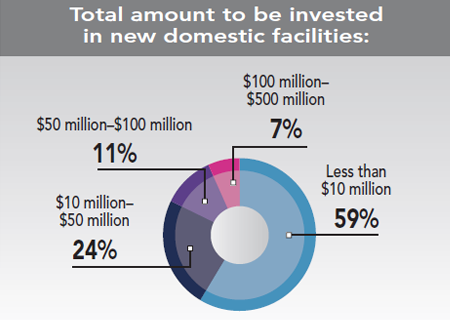
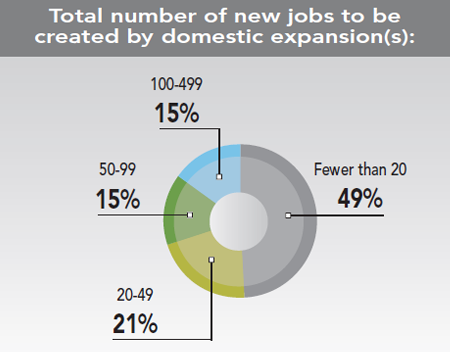
Most of these new domestic facilities will create fewer than 100 jobs, say three quarters of the Corporate Survey respondents. And the majority of the respondents (59 percent) also plan on spending less than $10 million to establish these facilities. Once again, these results are quite similar to those of our prior year’s Corporate Survey.

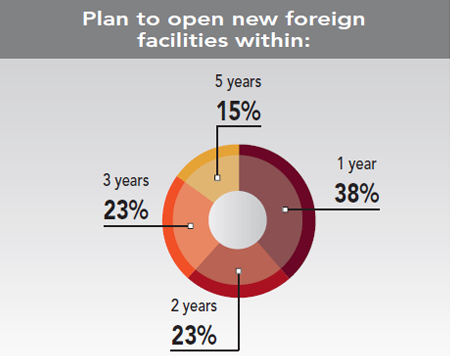
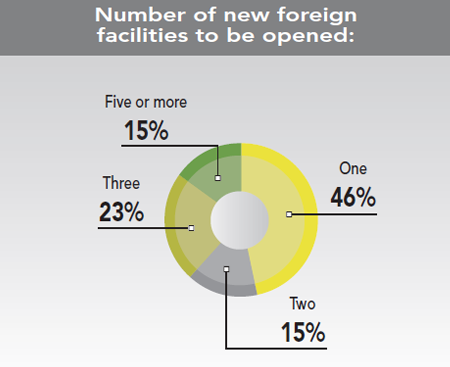
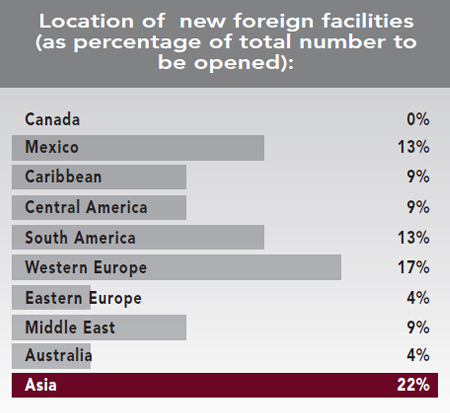
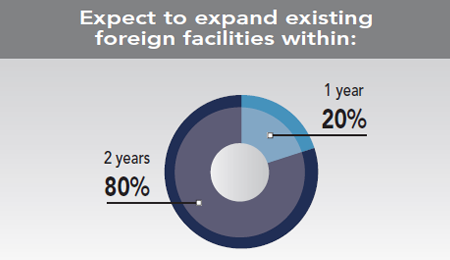
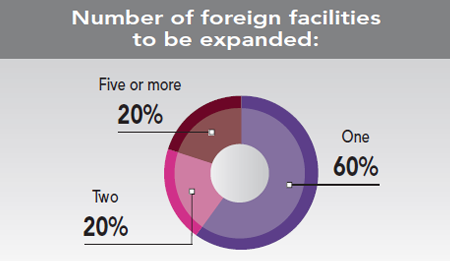
Although fewer of our respondents have plans for new foreign facilities, of those that do, about 60 percent plan to open them within two years, with 46 percent opening just one.
Figure 18: Location of new foreign facilities (as percentage of total number to be opened)
In a dramatic change, none of the Corporate Survey respondents’ foreign facilities are planned for Canada — down from the 25 percent of the total reported by the prior year’s respondents. Plans for new facilities in Western Europe increased from 9 percent to 17 percent of the total reported by this year’s respondents, and Mexico increased from 9 percent to 13 percent of the total. Plans for Asia held relatively stable, with 22 percent of the total planned new foreign facilities slated for that region. Of those, more than 70 percent are planned for China, despite its increasing costs and troubling economic picture.

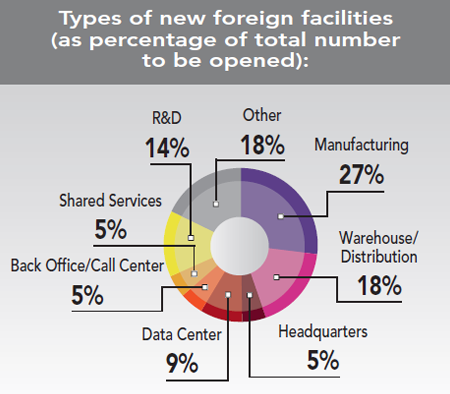
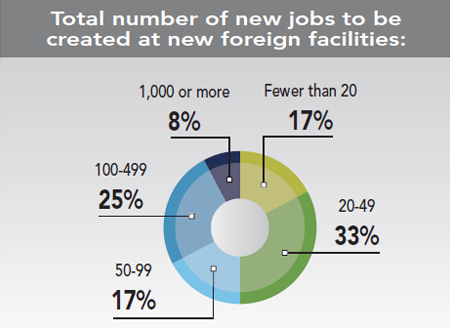
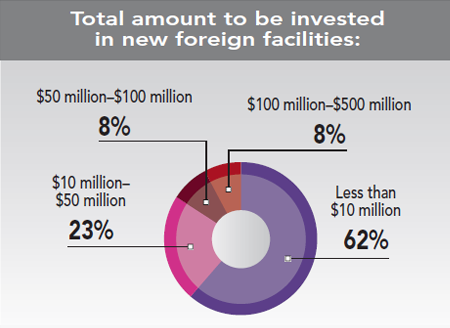
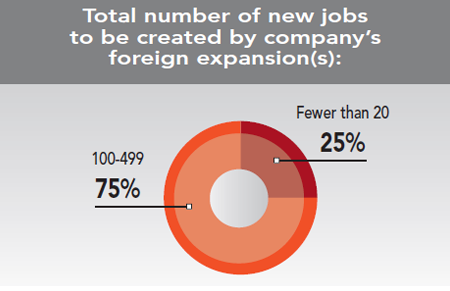
More than a quarter of the new foreign facilities planned by our Corporate Survey respondents will be manufacturing plants, and 18 percent will be warehouse/distribution facilities. The new foreign facilities will create only slightly more jobs than the domestic ones, with two-thirds of the respondents saying fewer than 100 jobs will be created at new foreign facilities. Once again, for the majority of the respondents (62 percent) these new facilities will represent an investment of less than $10 million.

Next: Corporate Respondents’ Expansion and Relocation Plans

Exclusive Research