
Last year started well for the manufacturing sector, though growth slowed as the risk for a downturn in global manufacturing increased. The Institute for Supply Management’s Manufacturing PMI fell in December 2019 for the fifth straight month to 47.2 — the lowest level since June 2009 — as new orders, production, employment, and new export orders shrank at a faster pace and price pressures increased.
“Global trade remains the most significant cross-industry issue, but there are signs that several industry sectors will improve as a result of the phase-one trade agreement between the U.S. and China,” said Timothy R. Fiore, chair of the institute, in a statement.
More good news came in the form of the recently signed US-Mexico-Canada Agreement (USMCA), which replaced and improved upon NAFTA. According to the Business Roundtable, “Building off the current foundation of duty-free trilateral trade and integrated supply chains across North America, USMCA…will increase U.S. jobs, exports and economic growth.”
Nevertheless, “While the abatement of trade and tariff issues has helped improved confidence, CEOs still remain apprehensive about global growth prospects in early 2020,” said Lynn Franco, Senior Director of Economic Indicators at The Conference Board.
34th Annual Corporate Survey
-
Chart 1

-
Chart 2
-
Chart 3
-
Chart 4
-
Chart 5
-
Chart 6
-
Chart 7
-
Chart 8
-
Chart 9
-
Chart 10
-
Chart 11
-
Chart 12
-
Chart 13
-
Chart 14
-
Chart 15
-
Chart 16
-
Chart 17
-
Chart 18
-
Chart 19
-
Chart 20
-
Chart 21
-
Chart 22
-
Chart 23
-
Chart 24
-
Chart 25
-
Chart 26
-
Chart 27
-
Chart 28
-
Chart 29
-
Chart 30
-
Chart 31
-
Chart 32
-
Chart 33
-
Chart 34
-
Chart 35
-
Chart 36

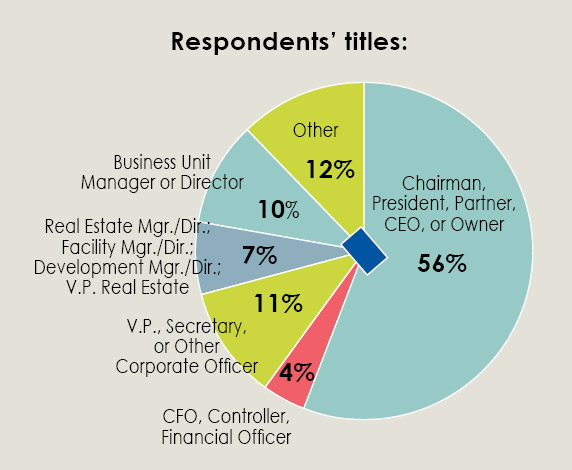
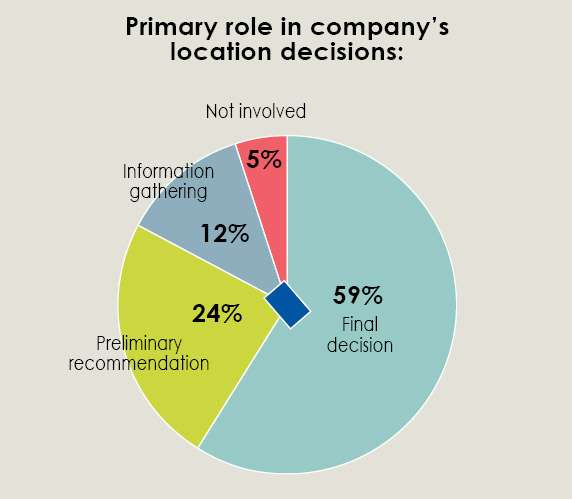

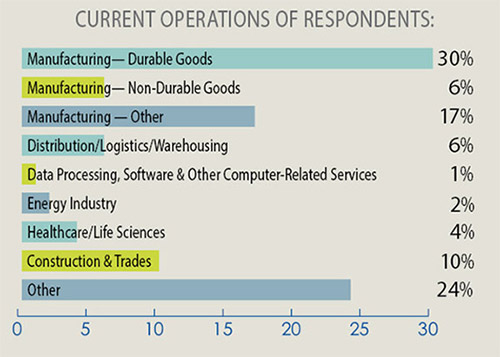
Our Corporate Respondents
Some 100 corporate executives responded to our annual survey. More than half of them are with manufacturing firms and are the top-level executive at their firms, i.e., chairman, president or CEO, or owner, and nearly 60 percent are responsible for their companies’ final site location decision.
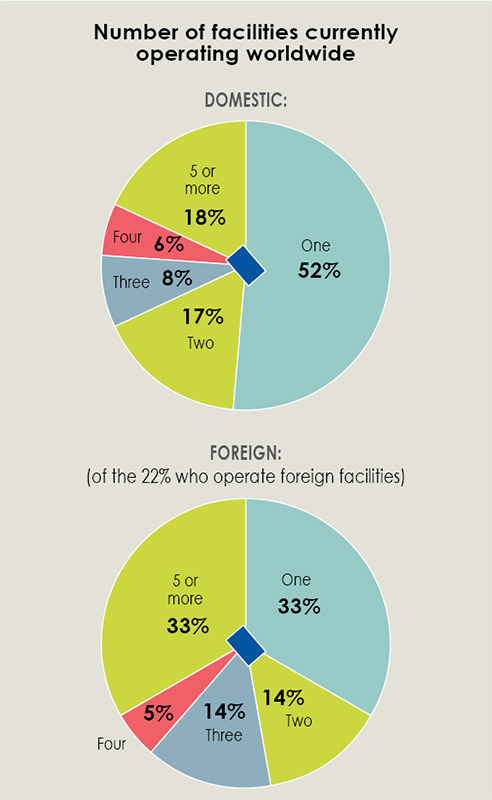
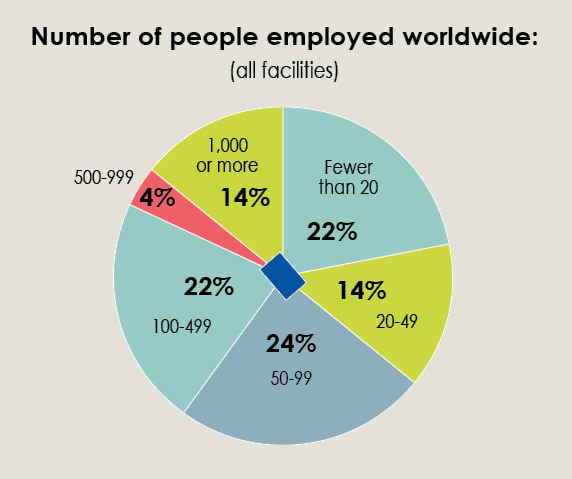
Of the respondent companies, about half operate just one domestic facility, but nearly a fifth operate five or more. Only 22 percent of the respondents operate foreign facilities; of those, a third operate just one and a third operate five or more. Sixty percent say their companies employ fewer than 100 people.
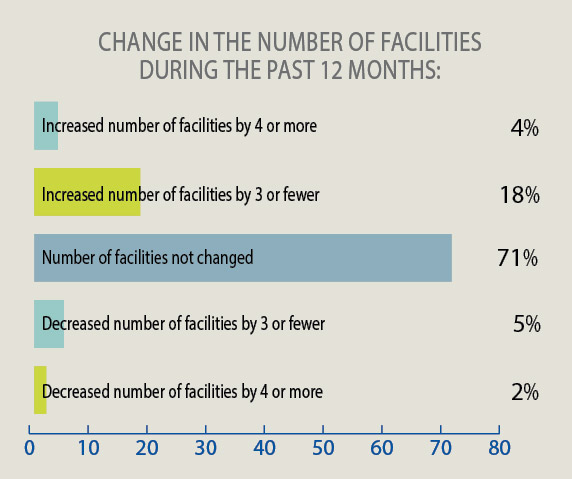
When asked about the change in the number of facilities their companies operate, only 22 percent say they had an increase in that number over the last 12 months. About 70 percent report no change in the number of company facilities over that period.
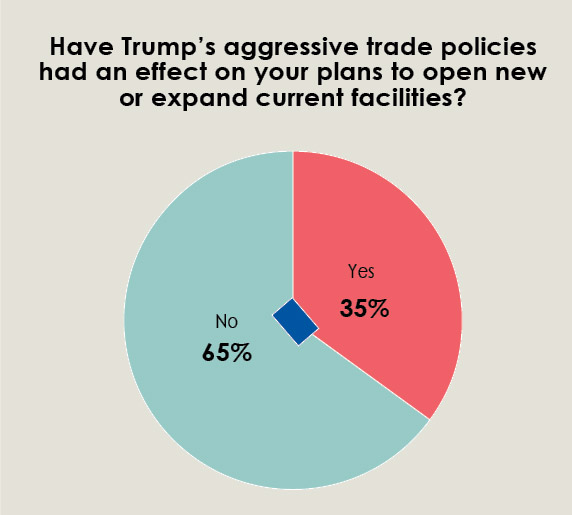
If we’re wondering whether or not the Trump administration’s aggressive trade policies are responsible for this lack of movement, about two thirds of the respondents say the answer is “no.”
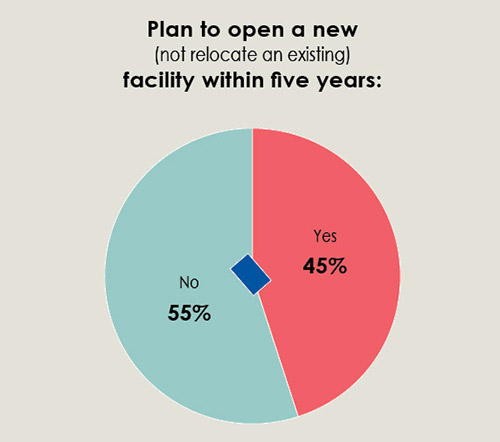
New Facility, Expansion & Relocation Plans
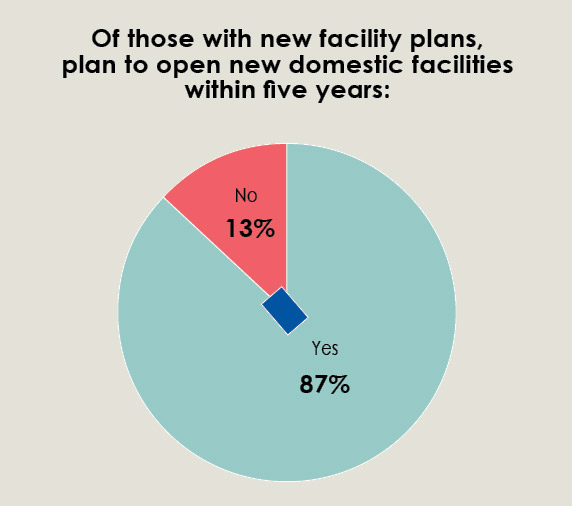
While most Corporate Survey respondents did not change their number of facilities in the past 12 months, 45 percent claim they plan to open a new facility within the next five years. Of those, nearly all — 87 percent — say they plan to open new domestic facilities.
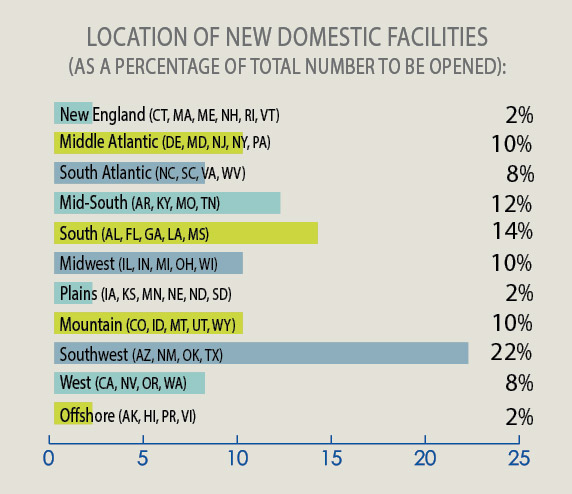
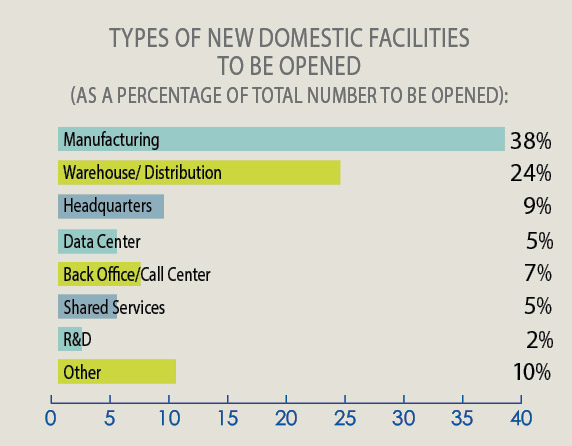
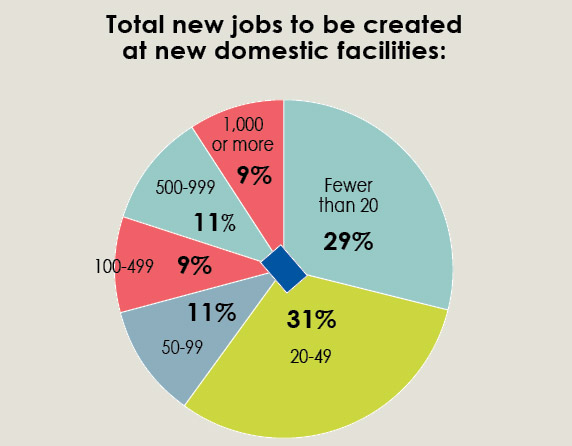
Overall, southern states will garner most of the new domestic facilities, with 22 percent going to the Southwest, a quarter to the deep South and Mid-South, and 8 percent to the South Atlantic States. Nearly 40 percent of these new domestic facilities will house manufacturing operations and a quarter will be warehouse/distribution centers, although — in total — the new domestic facilities are not projected to create many jobs: about 70 percent of the respondents expect them to create fewer than 100 jobs.
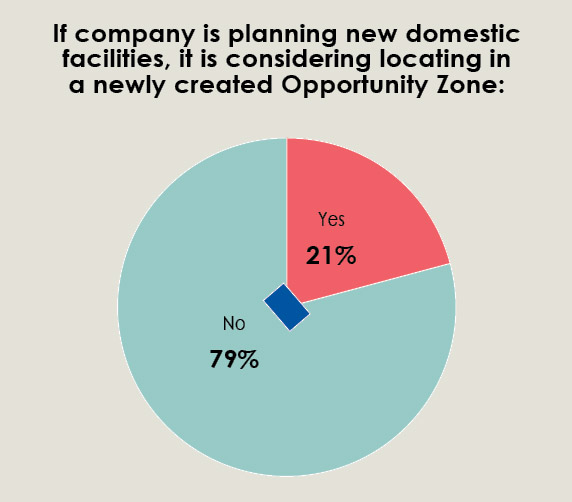
Although much has been made of the advantages afforded to investing in Opportunity Zones that were created as part of the Trump administration’s tax reform law, only a fifth of our Corporate Survey respondents are considering locating a domestic facility in one of these areas.
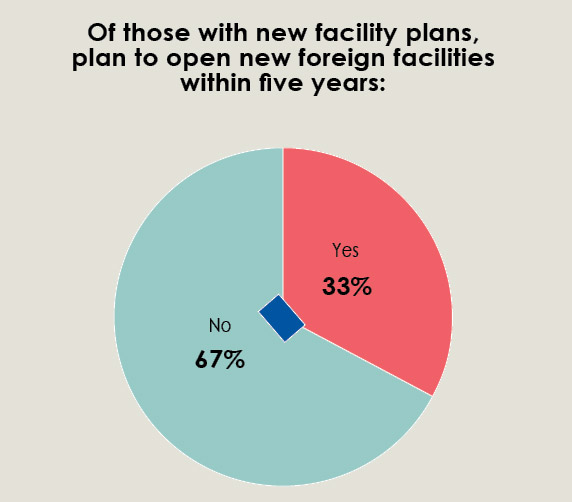
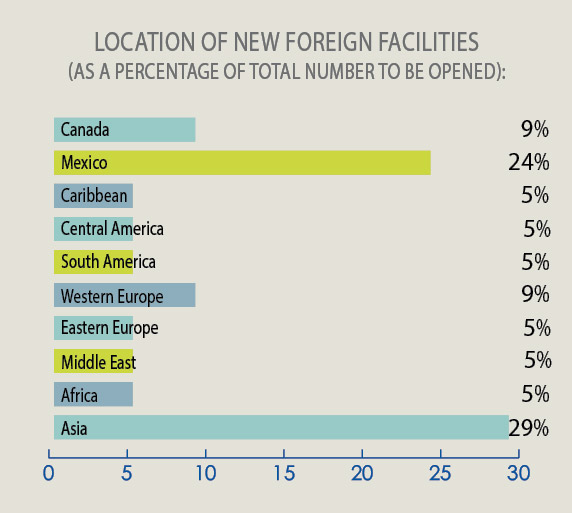
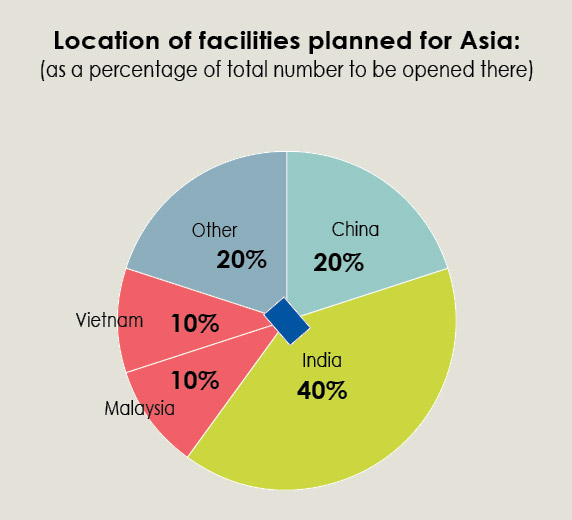
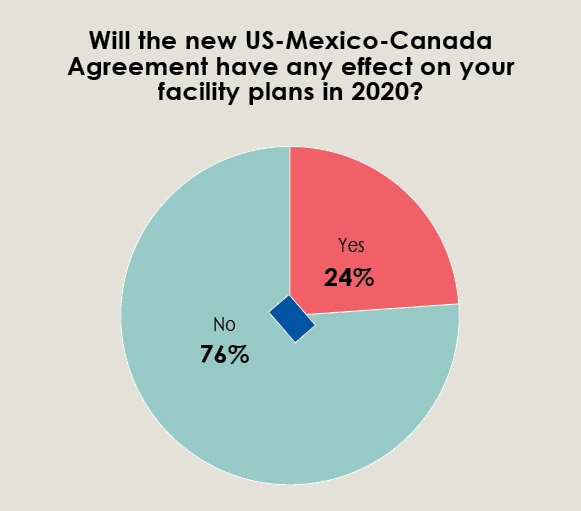
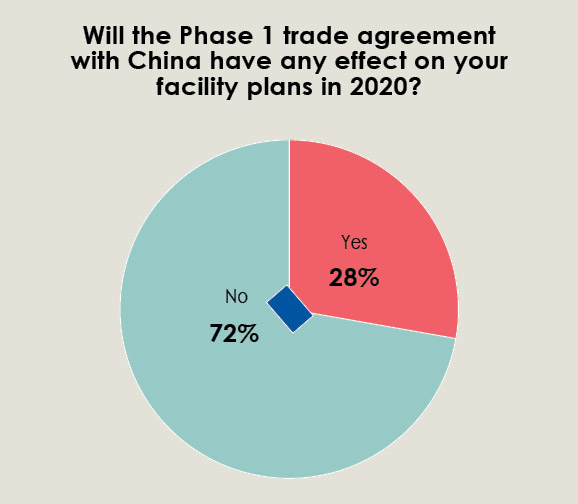
Of those with new facility plans, only a third claim to have plans for new foreign facilities. About a quarter of these new foreign facilities are slated for Mexico and nearly 30 percent for Asia. Interestingly, of those slated for Asia, twice as many — 40 percent — will go to India as compared to China (20 percent). It’s interesting, however, that about three quarters of the Corporate Survey respondents say the new US-Mexico-Canada Agreement as well as the Phase 1 China trade deal will have no effect on their 2020 facility plans.
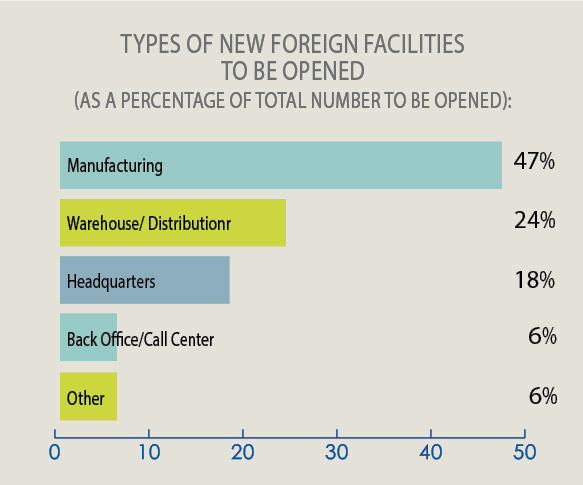
Nearly half of new foreign facilities are expected to be manufacturing operations, a quarter will be warehouse/distribution centers, and 18 percent will house headquarters functions (twice as many as are planned domestically). The new foreign facilities are also expected to create more jobs than the domestic ones — 42 percent of the Corporate Survey respondents claim these facilities will create between 100–499 jobs.
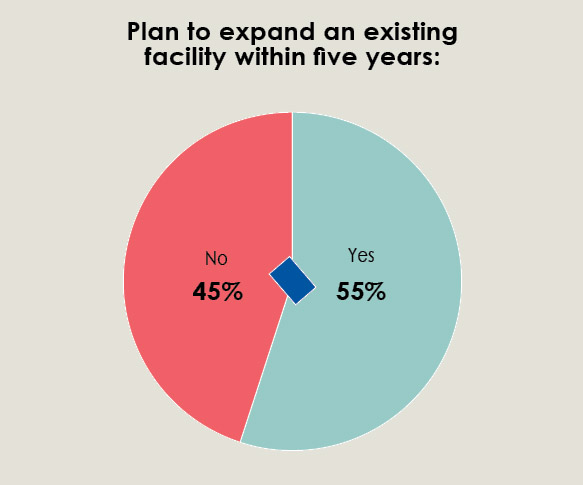
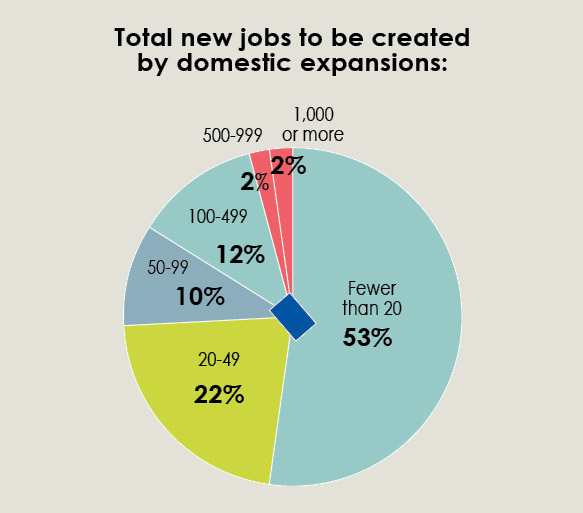
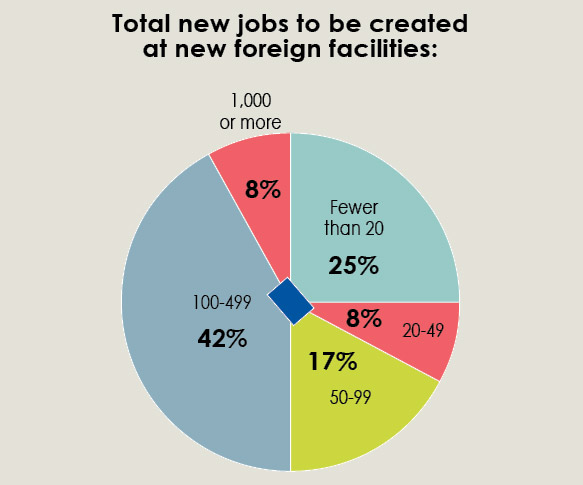
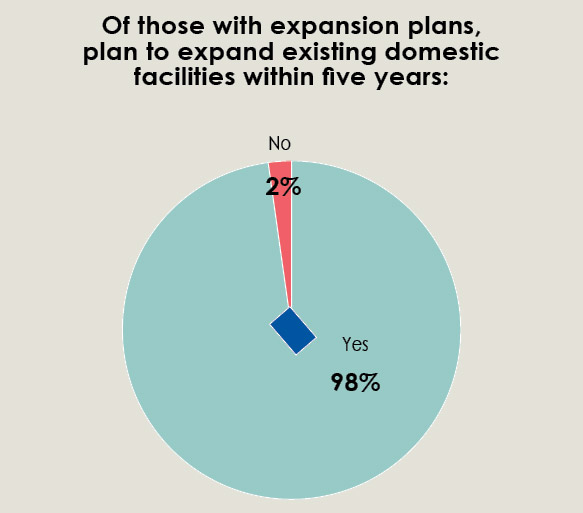
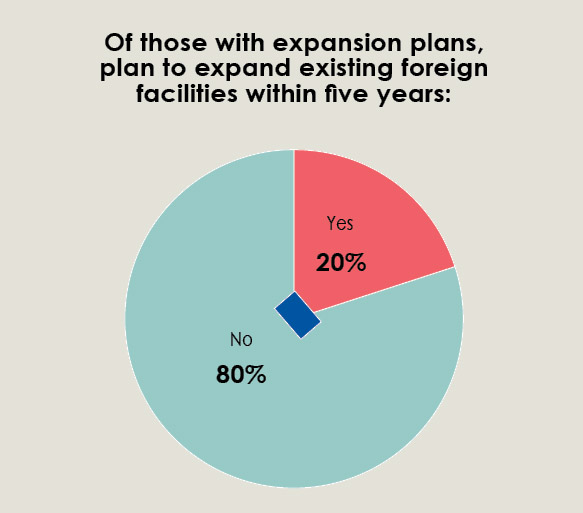
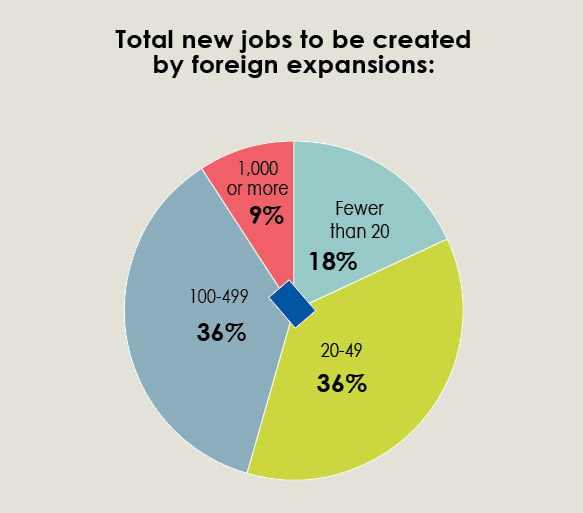
Slightly more than half of the respondents also plan to expand an existing facility over the next five years. Of those, nearly all plan to expand domestic facilities, while only 20 percent plan to expand foreign facilities. Nevertheless, 85 percent of the respondents say the domestic expansions will create fewer than 100 jobs, while 45 percent say the foreign expansions will create between 100 and 1,000+ jobs!
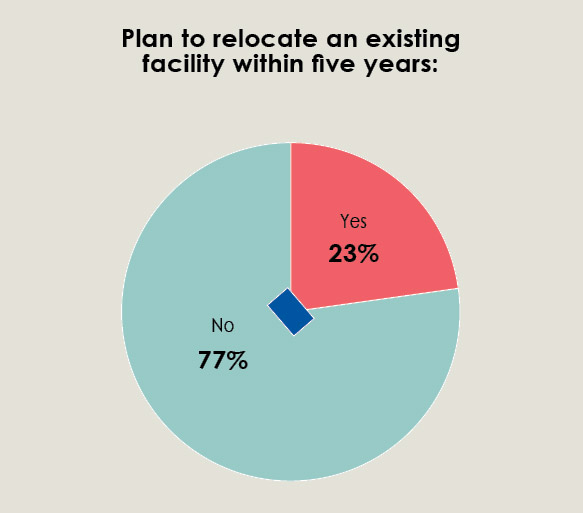
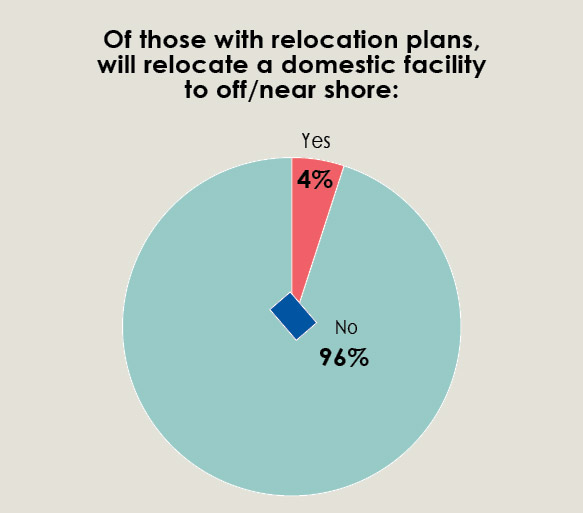
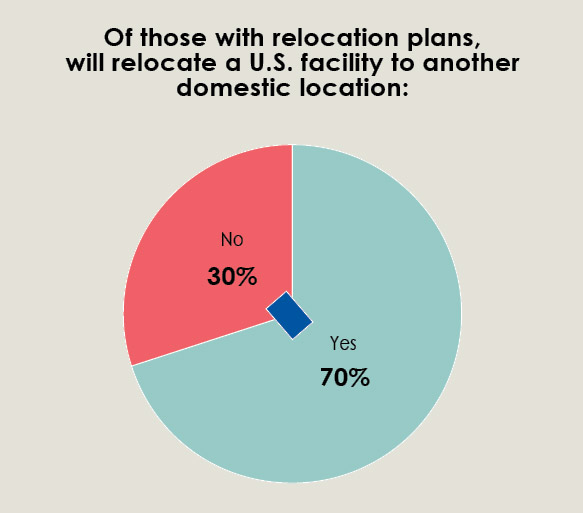
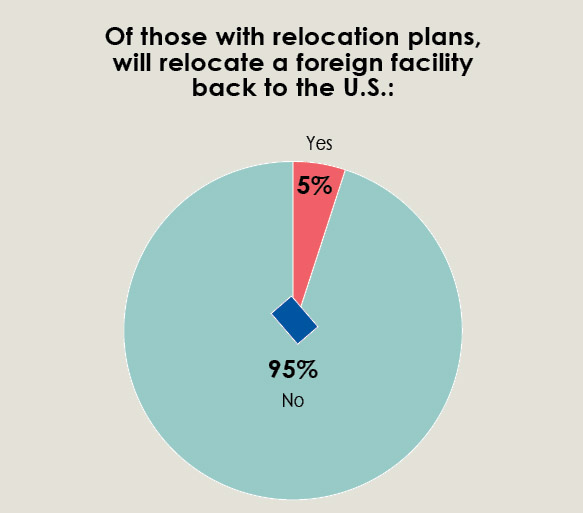
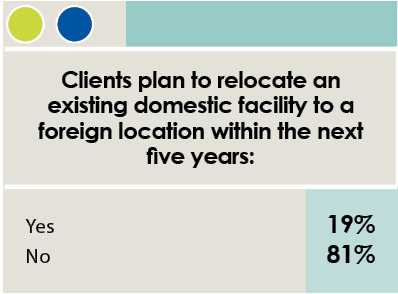
As far as relocation plans, only about a quarter of the respondents plan to relocate an existing facility within the next five years. Of those with plans, 70 percent will engage in a domestic-to-domestic relocation, with just 4 percent relocating a domestic operation to offshore, and 5 percent relocating a foreign facility’s operations back to the U.S. Again, we see that when it comes to these respondents, current trade policy does not appear to be a driving force.
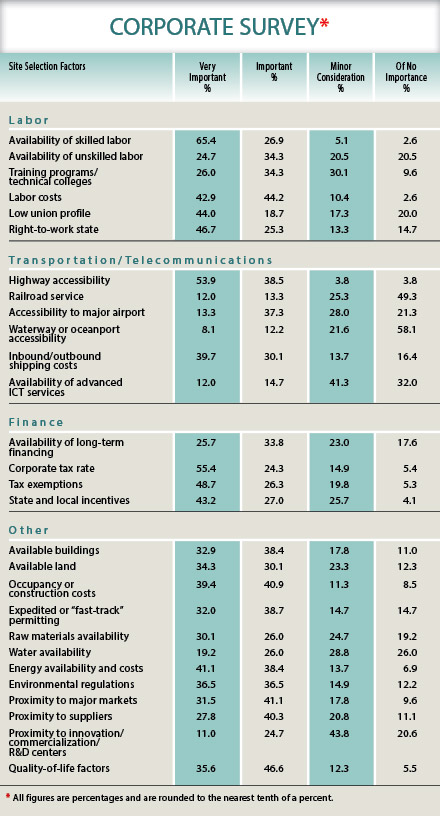
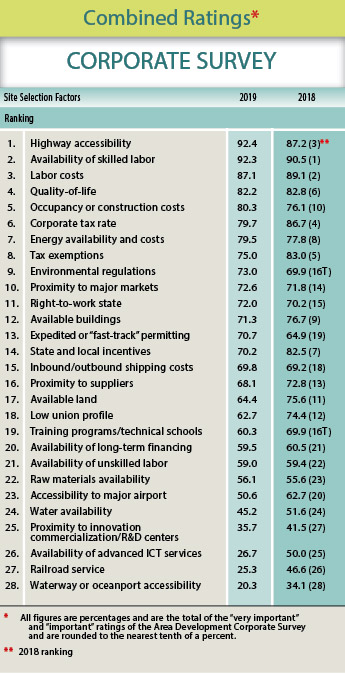
Finally, we ask our survey-takers to rate the location factors they consider when making new facility, expansion, or relocation plans as either “very important,” “important,” “minor consideration,” or “of no importance.” We then add the “very important” and “important” ratings together in order to rank the factors in order of importance.
Historically, highway accessibility has held the first or second spot in the rankings and this year is no exception: 92.4 percent of the Corporate Survey respondents rated highway accessibility “very important” or “important,” ranking it No. 1, closely followed by availability of skilled labor, ranked No.2 among the site selection factors and considered “very important” or “important” by 92.3 percent of the survey respondents. With unemployment at 3.6 percent according to the Bureau of Labor Statistics — and consequently more job openings than people to fill them — it’s no surprise that this factor is a top concern. Labor costs ranked third, with a combined importance rating of 87.1 percent. A tight labor market, as well as recent minimum wage increases in cities and states across the nation, has kept labor costs at the forefront for our corporate executive readers. And sought-after workers — especially tech-savvy millennials and GenZers — can be choosy about where they work so it’s no surprise that the quality-of-life factor maintains a combined importance rating above 80 percent and is now the No. 4 site selection factor.
Ranking fifth — up from 10th in the previous survey — with 80.3 percent of the respondents ranking the factor as “very important” or “important” is occupancy or construction costs. This is no surprise as construction costs continue to rise with increases in material prices and labor costs. Material costs have been affected by higher tariffs on steel and aluminum as well as Canadian lumber.
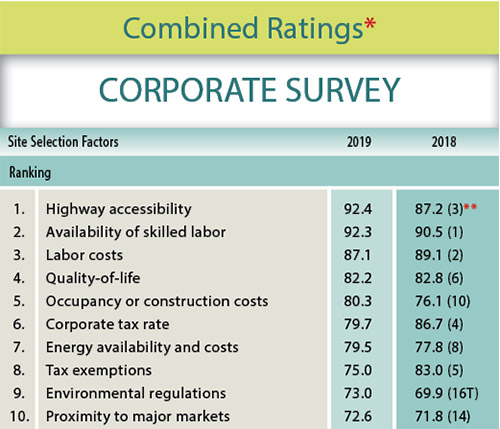
The No. 9 factor, environmental regulations, jumped from the 16th spot in the previous year’s survey and is now considered “very important” or “important” by 73 percent of the survey respondents. Right-to-work state also jumped in the rankings to No. 11, with a 72 percent combined importance rating, from the 15th spot previously. In juxtaposition to that, with just 6.4 percent of workers in the private-sector unionized today (compared to 16.8 percent in 1983), fewer than 63 percent of the respondents consider low union profile as “very important” or “important,” ranking this factor No. 18, down from 12th place.
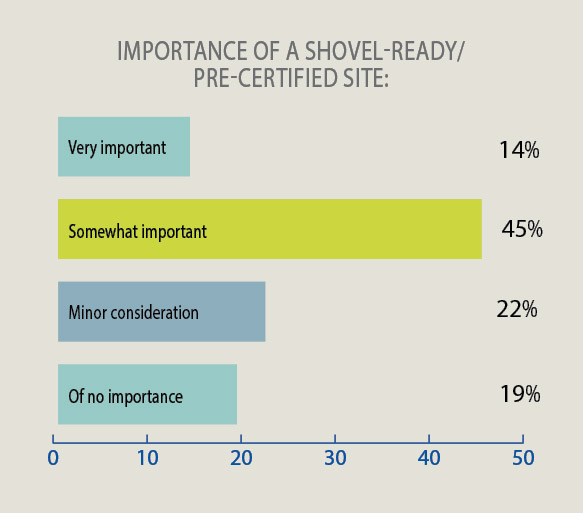
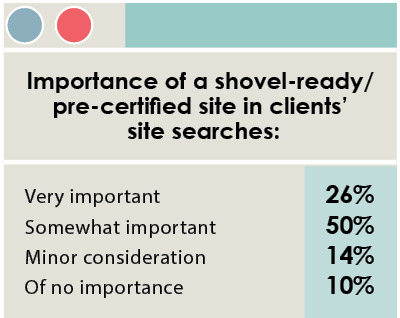
In fact, our annual Corporate Survey shows many factors decreasing rather than increasing in importance ratings. Available land was considered “very important” or “important” by three quarters of the previous year’s survey respondents, but only received a combined importance rating of 64.4 percent this year, dropping from No. 11 to No. 17 in the rankings. Nonetheless, nearly 60 percent of the Corporate Survey respondents consider the availability of a shovel-ready/pre-certified site very or somewhat important in the location decision.
Chief among the factors decreasing in importance ratings are the bottom ranked factors: availability of advanced ICT services dropped from a 50 percent combined importance rating to just 26.7 percent. Perhaps the availability of these advanced communication services throughout most of the nation is now a given. Railroad service is now considered “very important” or “important” by only about a quarter of the Corporate Survey respondents, down from almost half in the previous year’s survey. And waterway or oceanport accessibility only received a 20.3 percent combined importance rating, down from its previous 34.1 percent rating. Perhaps these low transportation factor ratings are a function of the specific companies responding to this year’s survey.
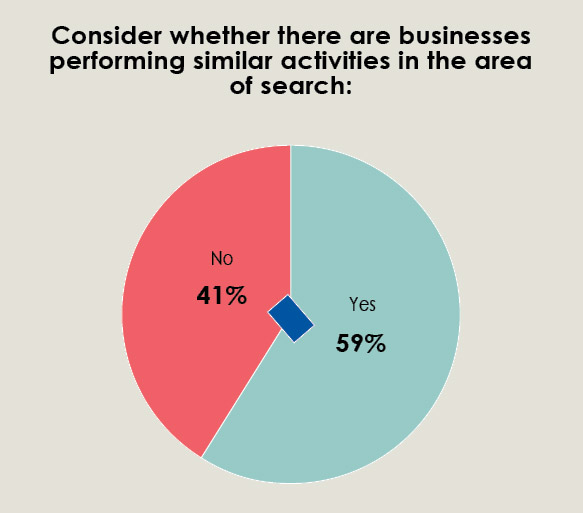
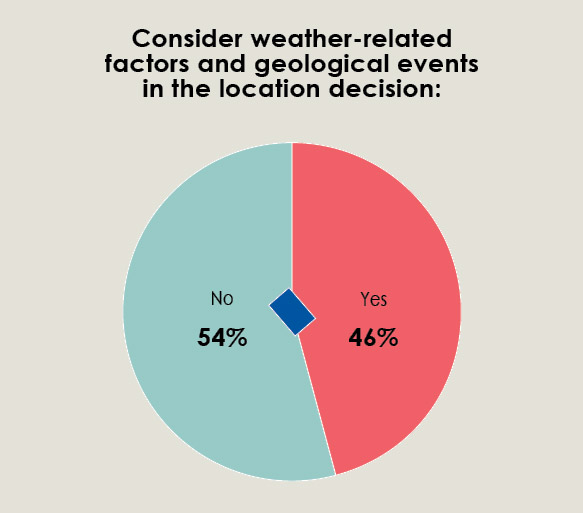
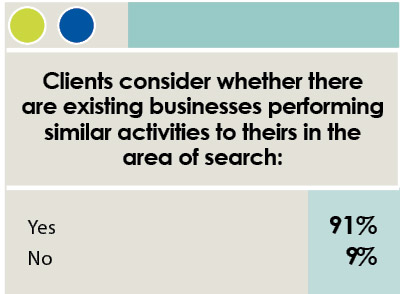
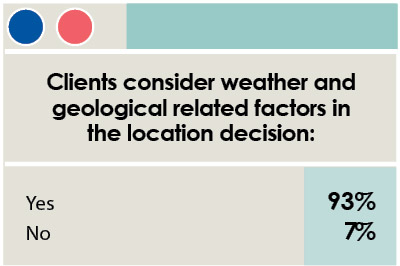
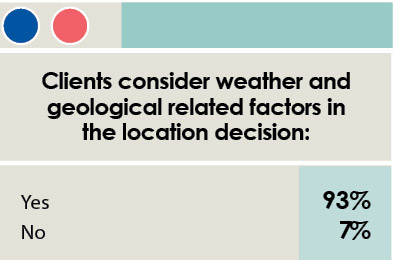
Finally, nearly half of the Corporate Survey respondents consider weather-related factors and geological events when making the location decision, and 59 percent consider whether or not there are businesses performing similar activities to theirs in the area of search.
16th Annual Consultants Survey
-
Chart 1
-
Chart 2
-
Chart 3
-
Chart 4
-
Chart 5
-
Chart 6
-
Chart 7
-
Chart 8
-
Chart 9
-
Chart 10
-
Chart 11
-
Chart 12
-
Chart 13
-
Chart 14
-
Chart 15
-
Chart 16
-
Chart 17
-
Chart 18
-
Chart 19
-
Chart 20
-
Chart 21
-
Chart 22
-
Chart 23
-
Chart 24
-
Chart 25
-
Chart 26
-
Chart 27
-
Chart 28
-
Chart 29
-
Chart 30

The Responding Consultants
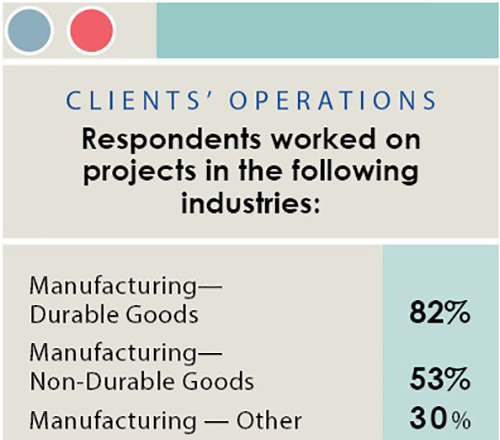
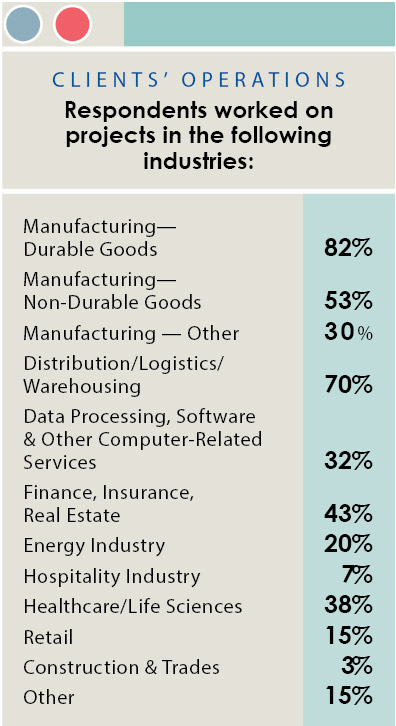
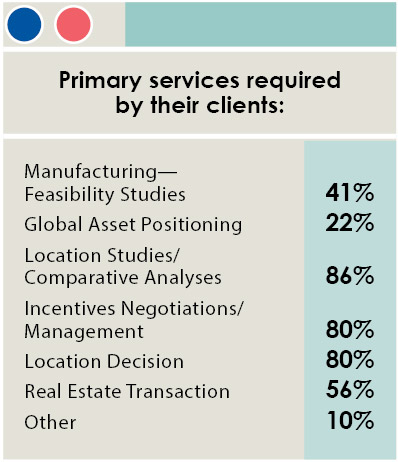
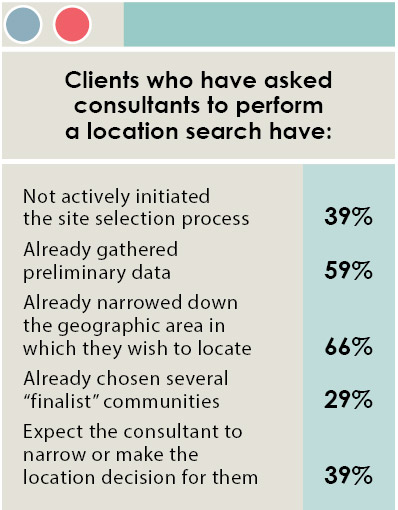
More than 80 percent of the responding consultants are working with manufacturing firms, while 70 percent are working on distribution/logistics projects. More than 80 percent also are performing location studies/comparative analyses and incentives negotiation/management for their client firms. In fact, about 40 percent say their clients expect them to narrow down and/or actually make the location decision.
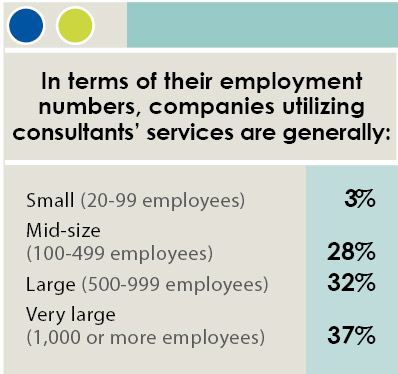
More than two thirds of the respondents say their clients are large firms in terms of employment numbers — 500–1,000+ employees. Only 18 percent of the Corporate Survey respondents had that number of employees so obviously we would expect the respondents to our Consultants Survey to report more robust plans in terms of new and expanded facilities.
Clients’ New Facility, Expansion & Relocation Plans
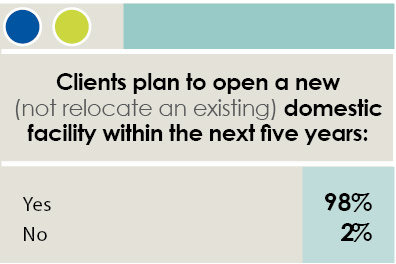
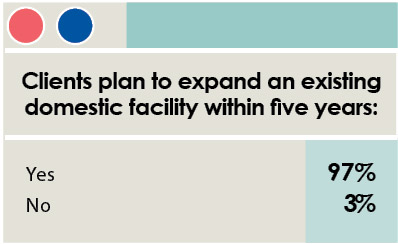
In fact, 98 percent of the responding consultants say their clients expect to open a new domestic facility within the next five years. About a quarter of these will be manufacturing facilities and another quarter will represent warehouse/distribution operations. The majority of these domestic facilities are slated for the southern states — deep South (16 percent), Southwest (15 percent), South Atlantic (13 percent), and mid-South States (12 percent), with 14 percent going to the Midwest.
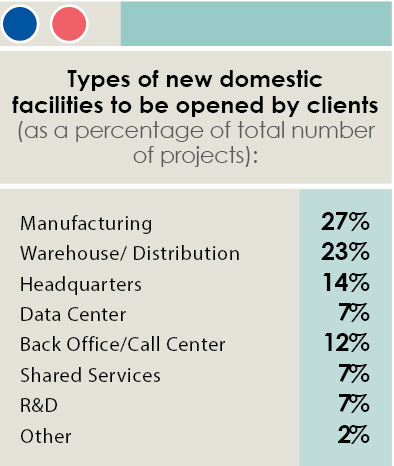
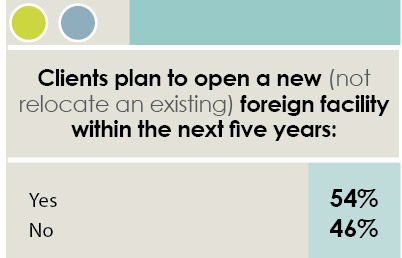
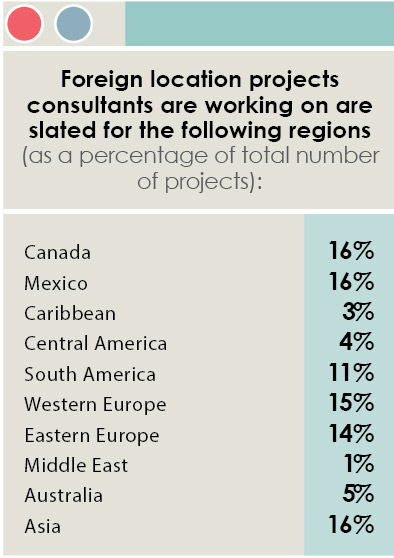
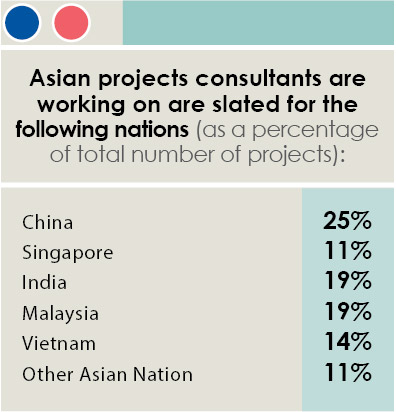
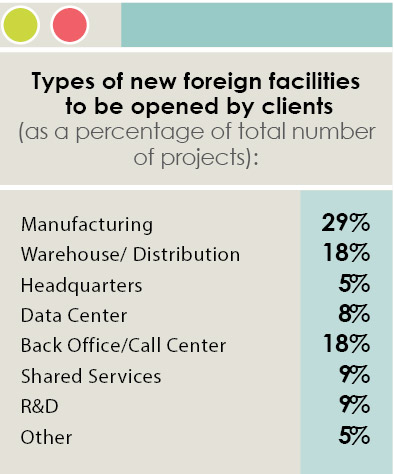
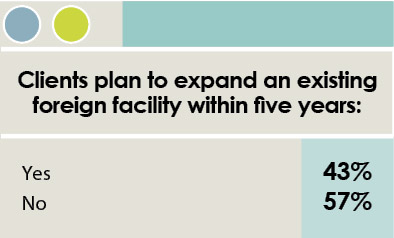
Only a third of the Corporate Survey respondents report new foreign facility plans, but more than half of the respondents to the Consultants Survey say their clients plan to open a new foreign facility within the next five years. About 30 percent of these will be manufacturing facilities and nearly a fifth will be warehouse/distribution centers, but nearly another fifth will be back office/call center operations. The new foreign facility projects the consultants are working on for their clients will be spread out among Canada, Mexico, and Asia — each of those regions receiving 16 percent of the projects — and Western Europe (15 percent), and Eastern Europe (14 percent). A quarter of the Asian projects will go to China with about a fifth each to India and Malaysia.

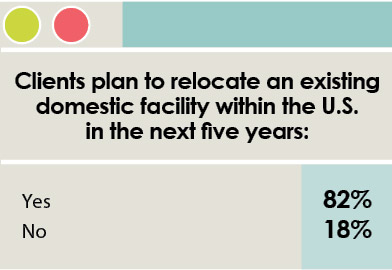
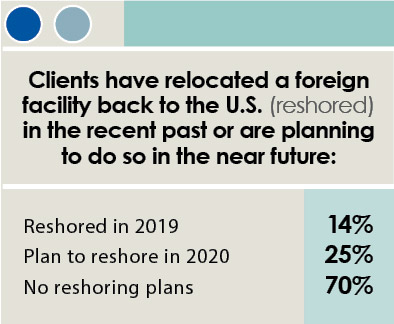
Interestingly, nearly 40 percent of the respondents say their clients re-shored a foreign facility back to the U.S. in 2019 or plan to do so in 2020. It should be noted that practically all (95 percent) of the Corporate Survey respondents have neither offshoring nor reshoring plans.
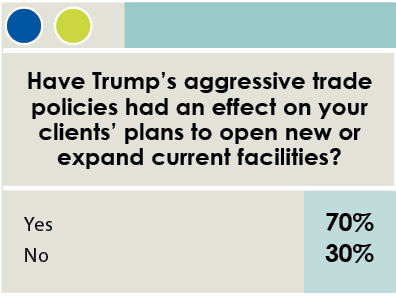
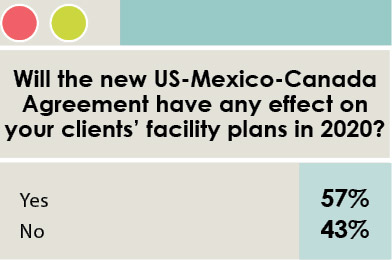
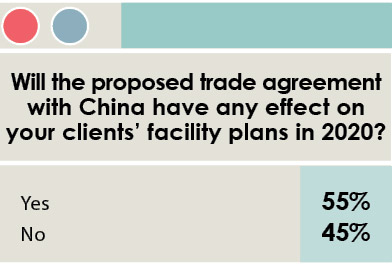
It appears from the consultants’ responses that their clients have been much more affected by the Trump administration’s trade policies, with 70 percent saying these aggressive trade policies have had an effect on those plans. More than half also say the new US-Mexico-Canada Agreement as well as the Phase 1 China trade deal will affect their clients’ plans.
Clients’ Site Selection Priorities
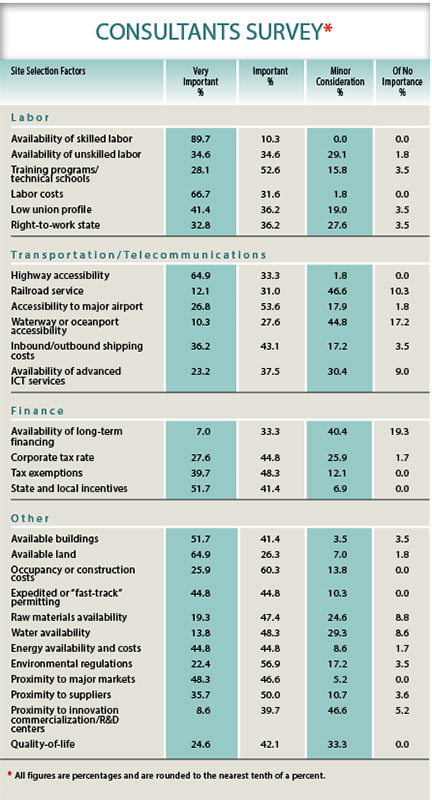
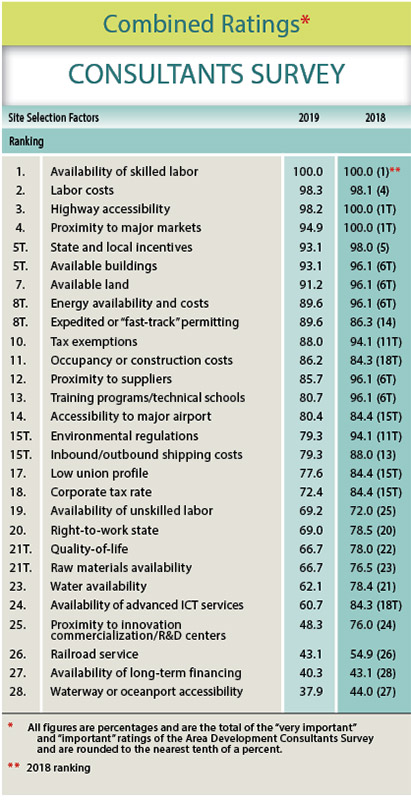
We also ask those taking the Consultants Survey to rate the location factors their clients consider when making new facility, expansion, or relocation plans as either “very important,” “important,” “minor consideration,” or “of no importance.” We then add the “very important” and “important” ratings together in order to rank the factors in order of importance.
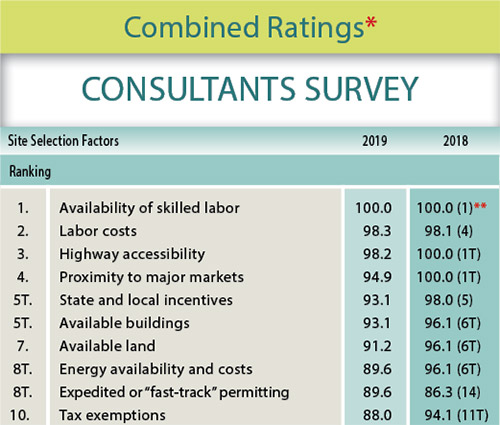
As to be expected, availability of skilled labor was rated as “very important” or “important” by 100 percent of the consultants, ranking that factor No. 1, as it was in the previous year’s survey. With competition for labor so intense, it’s no surprise that the labor costs factor was ranked No. 2 with a 98.3 percent combined importance rating, and practically tied with highway accessibility at No. 3, with a 98.2 percent combined importance rating. At least in the ranking of the top factors, the Corporate Survey and Consultants Survey respondents tend to agree.
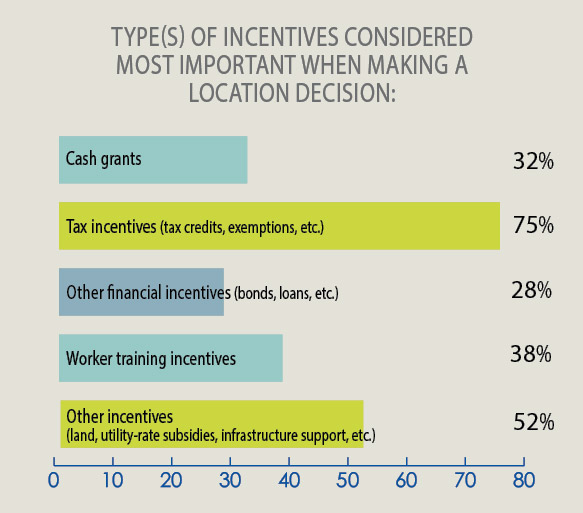
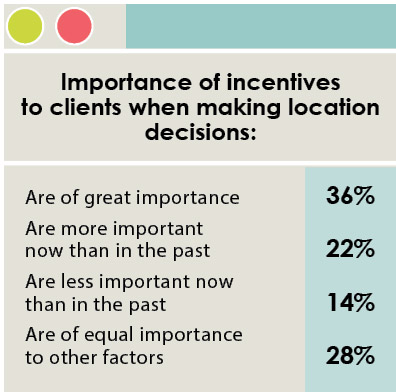
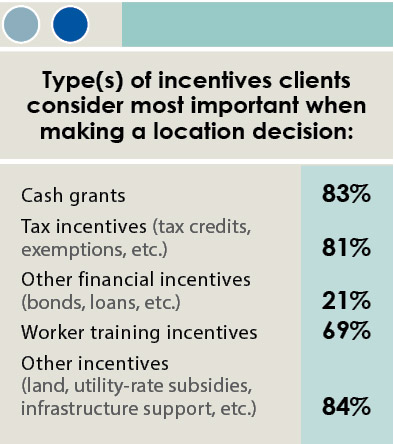
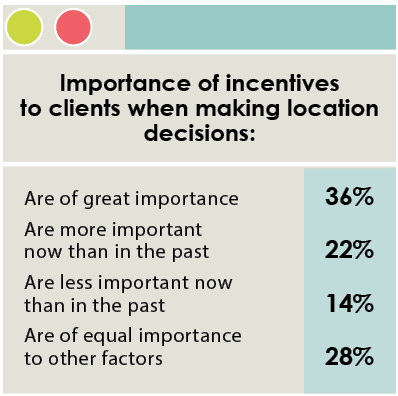
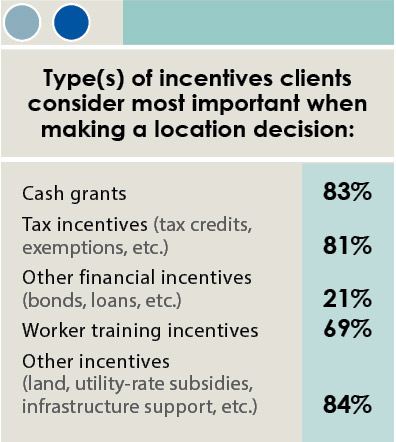
The consultants put state and local incentives in the No. 5 spot, considered “very important” or “important” by 93.1 percent of the respondents. That’s not surprising considering 80 percent of them say their clients expect them to negotiate and manage incentives. Also, the respondents to our Consultants Survey are serving much larger firms in terms of employment numbers, and larger firms are the ones usually courted with incentives by state and local economic developers. Additionally, more than 80 percent of these respondents say cash grants, tax incentives, and incentives in the form of free land, utility-rate subsidies, and infrastructure support are most important to their clients.
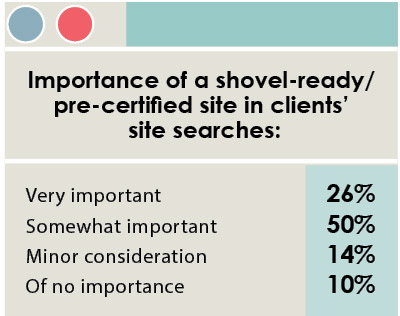
More than 90 percent of the responding consultants also rate available land and available buildings as “very important” or “important.” In fact, three quarters believe a shovel-ready/pre-certified site is very or somewhat important to their clients. Consultants’ realization that getting an operation up and running is critical in today’s competitive marketplace is also reflected in the nearly 90 percent combined importance rating of expedited or fast-track permitting.
What is also surprising is the drop in the rankings of training programs/technical schools from sixth place to No. 13 this year, with a combined importance rating dropping from 96.1 percent to just 80.7 percent. Even though that’s a higher importance rating given to this factor by the consultants than by the Corporate Survey respondents (just 60 percent rated it “very important” or “important”), it seems odd that this factor is not rated and ranked more highly by both groups of respondents, considering the fact that workers are lacking the necessary STEM and other advanced technology skills that industry requires today.
Environmental regulations also dropped in the rankings by four spots to No. 15. The consultants gave it a combined importance rating of 79.3 percent, down from its previous 94.1 percent. Could it be anticipated rollbacks of environmental regulations by the Trump administration are reflected in this ranking?
Finally, there’s a huge difference in how the Corporate Survey respondents and Consultants Survey respondents rate and rank quality of life. More than 82 percent of the corporate respondents rate quality of life as “very important” or “important,” placing this factor in the No. 4 spot. Meanwhile, only two thirds of the respondents to the Consultants Survey give this factor a combined importance rating, ranking it No. 21. A good quality of life is important to attracting skilled labor (the consultants’ No. 1 factor). Millennials are now the largest generation in the workforce, and we know they value quality of life — in other words, a work-life balance so it’s an anomaly that this factor is not considered more important by the consultants.