Top Performers
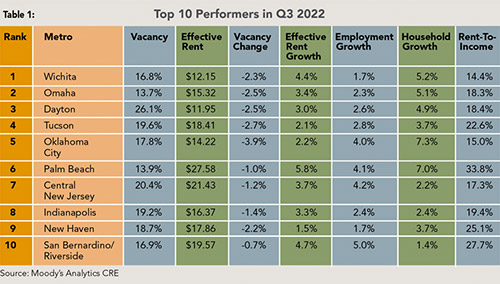
The Performance Index is designed to measure a metro’s office sector performance (effective rent growth and vacancy changes) compared to its own performance history and cross-metro performances. As shown in Table 1, four Midwest metros — Wichita, Omaha, Dayton, and Indianapolis — secured top-10 spots in the third quarter of 2022. In general, firms in the Midwest are benefiting from lower salary levels and office rent as compared to other regions. Wichita ($12.15/sq. ft.) and Dayton ($11.95/sq. ft.) offer the lowest office effective rent among our 82 primary metros, and all four are among the most affordable places for employees to live.
Two West metros — Tucson and San Bernardino/Riverside — made it to the top performer list. On the other end, well-known coastal markets including San Diego, Los Angeles, San Francisco, or San Jose all ranked in the bottom third. Tucson’s economic development was boosted by the boom of semiconductor manufacturing and high-tech/R&D/logistics support. San Bernardino/Riverside benefited from its emerging tech presence and still relatively affordable residential market.
Landlords and investors are closely monitoring and assessing the future of the office. On the East Coast, Central New Jersey and New Haven, Conn., outperformed their peers surrounding the broader New York area, and their office sectors had significant improvement as compared to a year ago. Diversified industry played a key role in both metros’ success, and New Haven is especially bolstered by its tech and life sciences industries.
Oklahoma City and Palm Beach, Fla., shined in the South, along with three Tennessee metros close behind: Memphis (#11), Nashville (#12), and Knoxville (#13). Population in-migration, skilled labor force, low cost of doing business, and diversified industries are some of the common advantages to consider for these five southern metros.

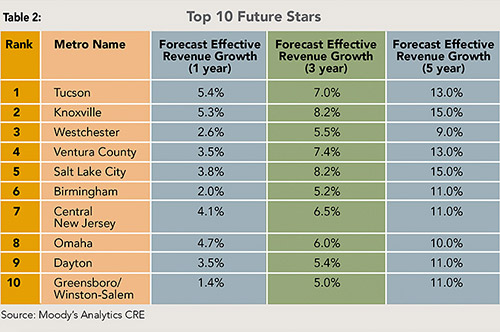
One quarter of good performance doesn’t always guarantee longer-term prosperity. To account for future performance, we used a Prosperity Index, which compared a metro’s one-year (near-term), three-year (mid-term), and five-year (long-term) forecast with other metros’ forecasts and against its own history.
The rankings of metros were shuffled, but all top-10 performers’ futures remain bright. As shown in Table 2, Tucson (#1), Central New Jersey (#7), Omaha (#8), and Dayton (#9) all secured their top-10 rankings in both performance and prosperity measures.
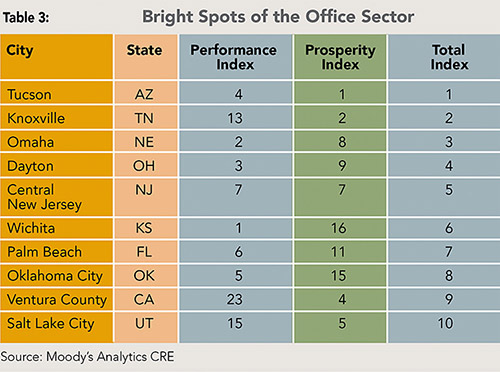
The Midwest and South Atlantic led the nation with above-average construction activities pre-pandemic, and cities in these regions have been gathering momentum in the post-pandemic period. Emerging semiconductor and tech industries are also fueling the growth for places such as Salt Lake City; Knoxville, Tenn.; and Ventura County, Calif., which were once down at the middle or even bottom third on the performance list during the same time last year.

To account for every office market’s current state and future trajectory, we combined their Performance and Prosperity Indexes into a Total Index. Table 3 lists the top 10 office markets which performed well in the third quarter and will continue to deliver above average performance in the next five years.
One quarter of good performance doesn’t always guarantee longer-term prosperity. Further, we classify all 82 primary office markets by their level of tech-related employment into “established,” “emerging,” or “other”1 markets. Unsurprisingly, 26 out of 28 metros in the top third of the Total Index ranking are “emerging” or “other” metros, while nearly half of the established tech markets ranked in the bottom third from both the current performance and future prospective.
The three Bay Area metros — San Francisco, San Jose, and Oakland-East Bay, which supported the rise of Silicon Valley — are now ranked at the bottom. Many local tech companies have moved their headquarters to states such as Texas, Tennessee, Arizona, or Nevada due to lower cost of doing business and living. For companies that are staying, many offer technology and continued flexibility for employees to work from anywhere without losing connection with the team.

- Metros with higher remote-working percentages tend to experience higher office vacancy increases; and a higher share of technology employees can tilt vacancy up further.
- In the post-COVID era, office and apartment rent growth in a given metro may no longer be in lockstep. Workforce used to follow where the physical offices are, but the reverse is happening at many places.
- The decision of office lease renewals will not only depend on trajectory of future office use, but also its pivotal role in talent recruiting, retention, or even promotion.
- Diversified industry, skilled workforce, and affordable housing options are important factors to hedge the market risk.
- Offices loaded with amenities such as meeting spaces, food and beverage options, health and cleanliness processes, and technology capabilities such as virtual reality and larger screens for video conferencing stand a better chance to draw employees back.
1 Established” — a metropolitan area as one if computer and math employment makes up 5% or more of total employment OR the metro has over 100,000 jobs in those occupations, including Seattle, Atlanta, San Francisco, San Jose, Raleigh, Dallas, Chicago, Los Angeles, New York, Baltimore, Austin, Colorado Springs, Boston, Denver and Washington, D.C.
“Emerging” — a metropolitan area that has at least 10% more growth in employment for computer and math occupations than the national average since 2018 OR at least 4% more median annual wage growth for computer and math occupations since 2015 compared to nationally. The 12 qualifying metros were Ventura, Buffalo, Greensboro, Miami, Greenville, Knoxville, New Orleans, Norfolk, San Bernardino, Nashville, Lexington, and Wichita.