Subscribe
Close
  • Free for qualified executives and consultants to industry

  • Receive quarterly issues of Area Development Magazine and special market report and directory issues

Renew

Top Performing Airports in 2014 for Air Cargo and Industrial RE

Q2 2014
Airports are increasingly focused on leveraging nearby commercial real estate assets and logistics corridors to position themselves as an essential link in the supply chain. In fact, some airports are now seeing more than 60 percent of their revenue derived from non-airline sources.

JLL’s proprietary Airport Index ranks Chicago, Miami, and Los Angeles, as the top performing U.S. airports this year based on criteria such as availability of industrial and warehousing space, access to large population centers, and air cargo growth prospects.

Top U.S. Airport Market Anchors
The top three “aerotropolis” districts—the areas surrounding these cargo-intense airports—stand out for their population access and infrastructure:
SlideshowTop Performing Airports in 2014 Top Performing Airports in 2014
Close
  • Oakland International Airport (OAK); 67.0 Airport Index Score; 27.8 Air Cargo Score; 39.2 Real Estate Score Oakland International Airport (OAK); 67.0 Airport Index Score; 27.8 Air Cargo Score; 39.2 Real Estate Score
  • Hartsfield-Jackson Atlanta International Airport (ATL); 74.1 Airport Index Score; 28.4 Air Cargo Score; 45.7 Real Estate Score Hartsfield-Jackson Atlanta International Airport (ATL); 74.1 Airport Index Score; 28.4 Air Cargo Score; 45.7 Real Estate Score
  • Newark Liberty International Airport (EWR); 83.8 Airport Index Score; 22.2 Air Cargo Score; 61.5 Real Estate Score Newark Liberty International Airport (EWR); 83.8 Airport Index Score; 22.2 Air Cargo Score; 61.5 Real Estate Score
  • Ted Stevens International Airport (ANC); 85.7 Airport Index Score; 54.2 Air Cargo Score; 31.5 Real Estate Score Ted Stevens International Airport (ANC); 85.7 Airport Index Score; 54.2 Air Cargo Score; 31.5 Real Estate Score
  • John F. Kennedy International Airport (JFK); 86.4 Airport Index Score; 50.0 Air Cargo Score; 36.5 Real Estate Score John F. Kennedy International Airport (JFK); 86.4 Airport Index Score; 50.0 Air Cargo Score; 36.5 Real Estate Score
  • Louisville International Airport (SDF); 97.4 Airport Index Score; 65.9 Air Cargo Score; 31.5 Real Estate Score Louisville International Airport (SDF); 97.4 Airport Index Score; 65.9 Air Cargo Score; 31.5 Real Estate Score
  • Dallas-Fort Worth International Airport (DFW); 102.6 Airport Index Score; 40.3 Air Cargo Score; 62.3 Real Estate Score Dallas-Fort Worth International Airport (DFW); 102.6 Airport Index Score; 40.3 Air Cargo Score; 62.3 Real Estate Score
  • Indianapolis International Airport (IND); 107.0 Airport Index Score; 51.7 Air Cargo Score; 55.4 Real Estate Score Indianapolis International Airport (IND); 107.0 Airport Index Score; 51.7 Air Cargo Score; 55.4 Real Estate Score
  • Memphis International Airport (MEM); 110.1 Airport Index Score; 70.2 Air Cargo Score; 40.0 Real Estate Score Memphis International Airport (MEM); 110.1 Airport Index Score; 70.2 Air Cargo Score; 40.0 Real Estate Score
  • Los Angeles International Airport (LAX); 111.9 Airport Index Score; 56.5 Air Cargo Score; 55.4 Real Estate Score Los Angeles International Airport (LAX); 111.9 Airport Index Score; 56.5 Air Cargo Score; 55.4 Real Estate Score
  • Miami International Airport (MIA); 123.8 Airport Index Score; 61.9 Air Cargo Score; 61.9 Real Estate Score Miami International Airport (MIA); 123.8 Airport Index Score; 61.9 Air Cargo Score; 61.9 Real Estate Score
  • O'Hare O'Hare International Airport (ORD); 137.7 Airport Index Score; 57.3 Air Cargo Score; 80.4 Real Estate Score
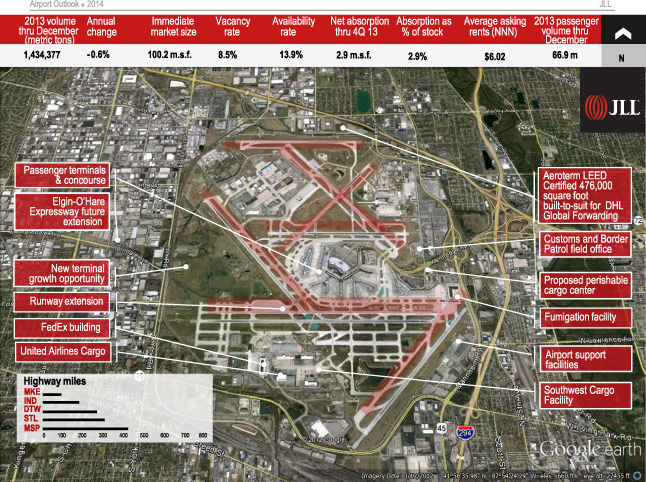
  1. Chicago O’Hare (ORD) moves to the top position, up from second in last year’s index. Infrastructure is a priority, with new cargo facilities planned that offer both airside and landside access. For supply chain executives, the greater Chicago market offers six major railroad connections, and is a one-day drive to nearly a third of North American consumers. This positions ORD as a gateway of choice- and investors are noticing that buildings are commanding higher rents than ever before within a 3-mile radius from ORD.
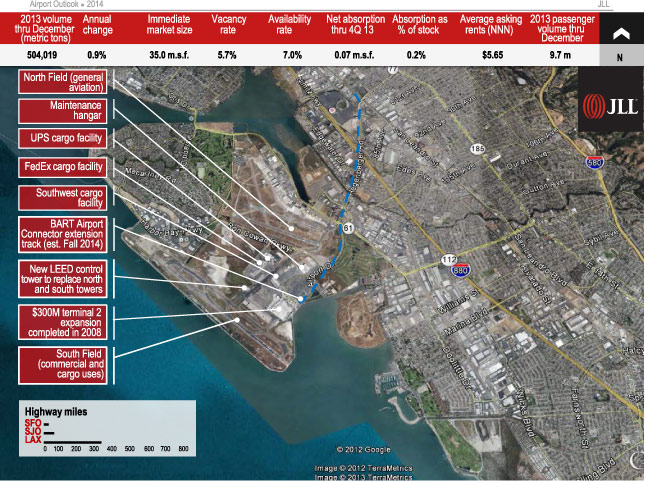
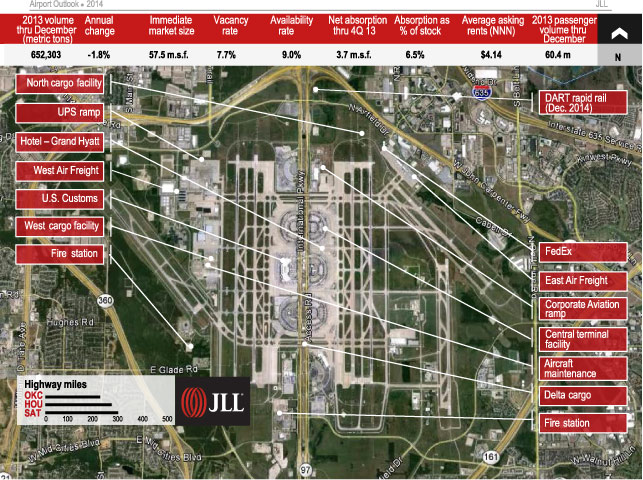
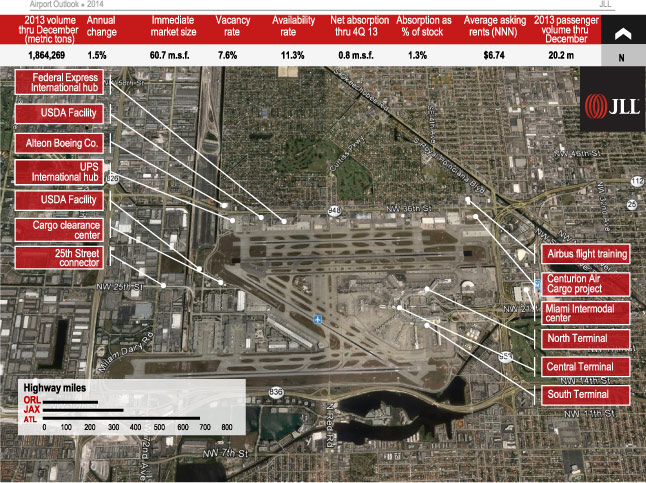
  2. Miami (MIA) scores second highest in the index, down from the top position in last year’s report. The airport and surrounding businesses control the food and flower trade (moving 71.2 percent of all U.S. perishables) and the lack of a single dominant carrier makes room for enhanced competition and demand for real estate.
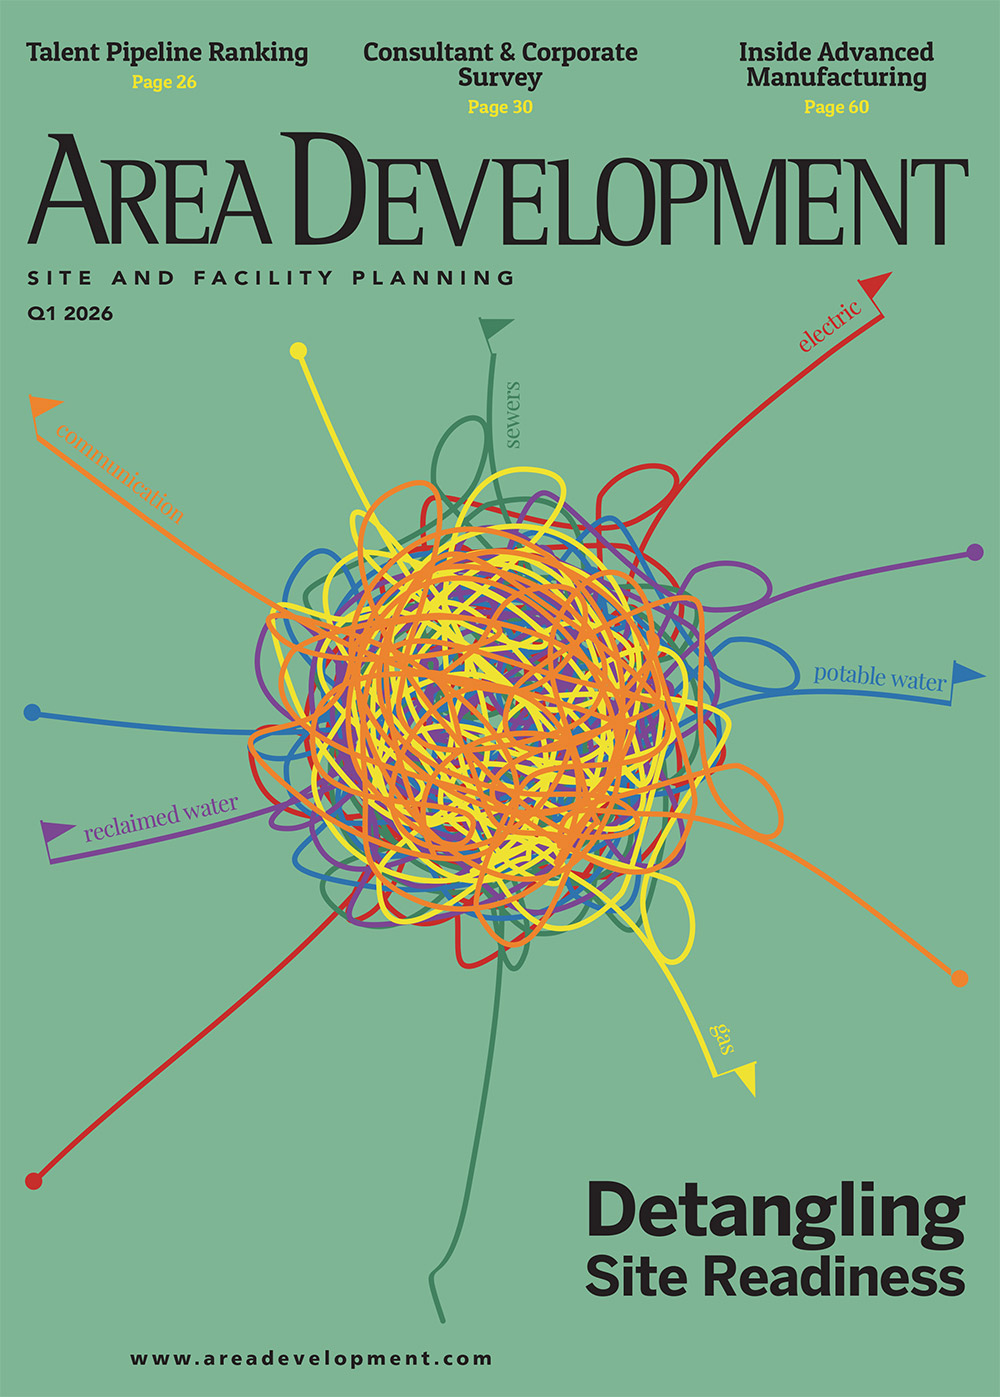
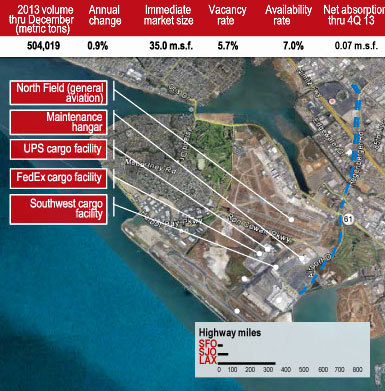
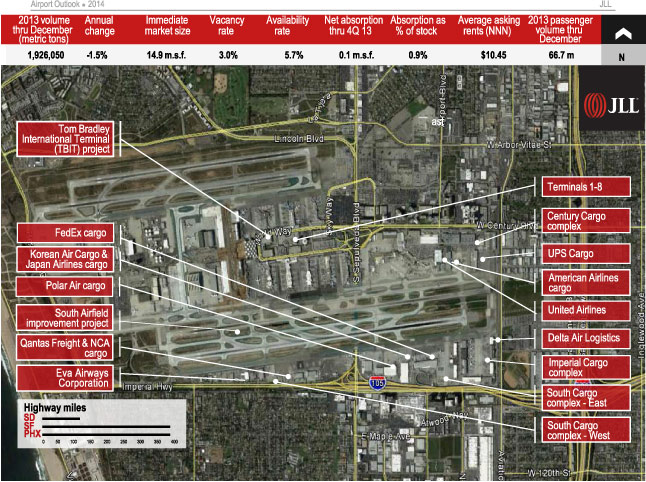
  3. Los Angeles (LAX) moved up in the rankings from last year’s report, and now ranks third. Freight-forwarders were especially active near the airport in 2013, and real estate demand from logistics providers, consumer non-durables and food & beverage was notable throughout the surrounding market. China remains LAX’s largest trading partner, followed by Japan, Hong Kong, Thailand and South Korea; goods that enter through this access point help serve Los Angeles County’s ten-million-strong population.
Expand Based on 13 measurable performance metrics in the categories of air cargo operations and real estate market factors, the Airport Scores Index is a subjective measure of an airport’s value to investors, developers and occupiers of airport-centric industrial properties.
Close Based on 13 measurable performance metrics in the categories of air cargo operations and real estate market factors, the Airport Scores Index is a subjective measure of an airport’s value to investors, developers and occupiers of airport-large-centric industrial properties.
Based on 13 measurable performance metrics in the categories of air cargo operations and real estate market factors, the Airport Scores Index is a subjective measure of an airport’s value to investors, developers and occupiers of airport-centric industrial properties.
PAGI Airport score methodology
The PAGI score was created to provide a quick snapshot of U.S. airports from the vantage point of the real estate stakeholder – those who invest in, develop or occupy industrial properties in airport-centric locations.

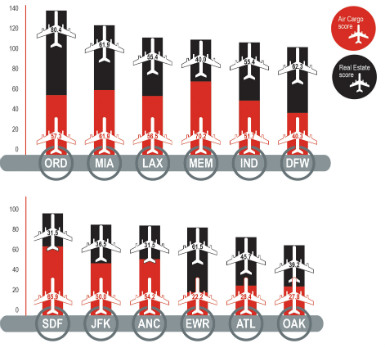
JLL based the index on 13 measurable performance metrics divided into two major categories: air cargo operations and real estate market factors. The resulting index score is then a combination of the performance metrics and provides a subjective measure of an airport’s value to JLL’s clients and their customers.
  • The real estate metrics taken into consideration include the total amount of industrial real estate stock within three miles of airport boundaries, the total stock within the broader industrial market served by each airport, the vacancy rate of properties within the three-mile buffer, the amount of available square footage within the three-mile buffer, and the rent premium (or discount) for properties within the three-mile buffer compared to the broader market. For this segment of the score, Chicago O’Hare (ORD) scored the highest, followed by Dallas/Fort Worth International Airport (DFW) and Miami (MIA).
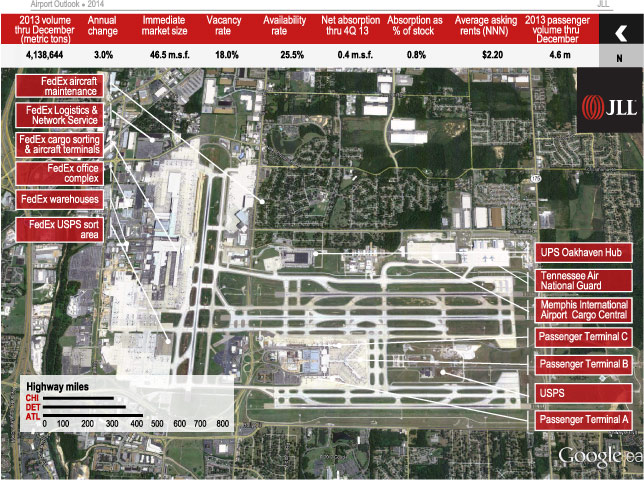
  • The air cargo operations metrics are designed to capture the health and growth of the airports as well as their functionality and connectivity. Our measures score the total volume of cargo traffic (measured in metric tons), short- and long-term growth in volume, flight operations capacity, runway length, the number of operational cargo airlines and the population reachable within one day’s drive from the airport. Memphis International (MEM) has the highest air cargo operations score followed by Louisville International Airport (SDF) and MIA.
To produce the final airport index score, the two components are weighted and then combined. It is important to note that all individual components of index are scored by percentile; hence the scores are relative to the best and worst performing airports in the group. This year’s highest ranked airport is ORD with a score of 138, followed by MIA at 124 and LAX with a 112.

Exclusive Research