Figure 1 - Current Operations of Respondents (1 of 44)
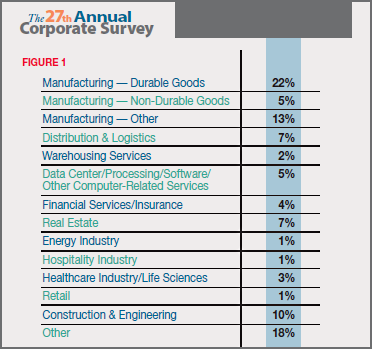
Forty percent of the respondents are with manufacturing companies, 9 percent represent logistics/distribution/warehousing establishments, and 10 percent are with construction and engineering enterprises.
Next: Figure 2 - Respondent's Title:
Figure 2 - Respondent's Title (2 of 44)
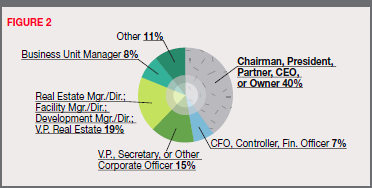
Importantly, 40 percent of the survey respondents are also the head of their companies, i.e., president, CEO, owner, etc. And another fifth are financial or other corporate officers.
Next: Figure 3 - Primary Role in Company's Location Decisions
Figure 3 - Primary Role in Company's Location Decisions (3 of 44)
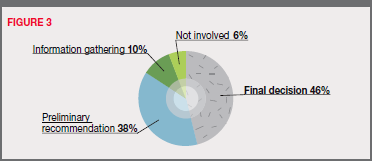
Nearly half of the respondents say they are responsible for their companies' final location decisions, and another 38 percent make the preliminary recommendations.
Next: Figure 4 - Number of Facilities Currently Operated:
Figure 4 - Number of Facilities Currently Operated (4 of 44)
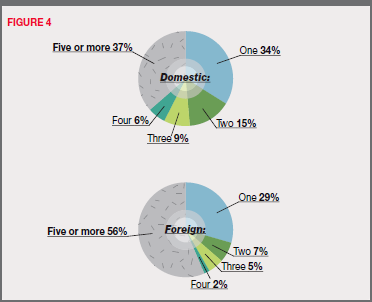
About a third of the respondents to the 27th Annual Corporate Survey say they operate just one domestic facility, and only slightly more than a third operate five or more domestic facilities. However, more than half of the respondents say they operate 5 or more foreign facilities, with another 29 percent claiming to operate just one foreign facility.
Next: Figure 5 - Number of Employees Worldwide
Figure 5 - Number of Employees Worldwide (5 of 44)
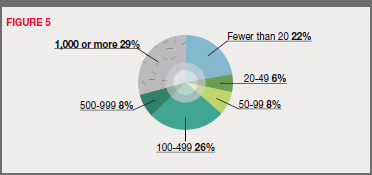
Nearly 30 percent of the Corporate Survey respondents say their firms employ 1,000 or more people worldwide. A quarter are mid-sized in terms of employment, with 100-499 workers, and about a fifth of the respondents say their work forces are comprised of fewer than 20 individuals.
Next: Figure 6 - Change in the Number of Facilities During the Past 12 Months
Figure 6 - Change in the Number of Facilities During the Past 12 Months (6 of 44)
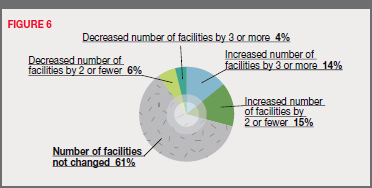
Nearly 30 percent of the respondents to the 27th Annual Corporate Survey say they have increased their number of facilities over the past year, while 10 percent say they have decreased their number of facilities, and 60 percent of the respondents have not changed their number of facilities at all - results that are remarkably consistent with the year prior's Corporate Survey.
Next: Figure 7 - Primary Reasons for those Increasing their Number of Facilities
Figure 7 - Primary Reasons for those Increasing their Number of Facilities (7 of 44)
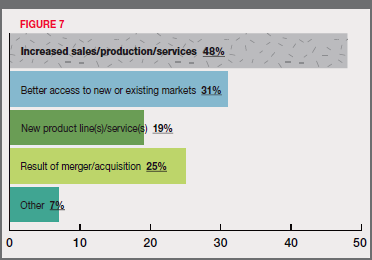
Nearly half of the respondents who say they have increased their number of facilities needed to increase production in response to increased sales, and nearly a third needed better access to markets.
Next: Figure 8 - Primary Reasons for those Decreasing their number of Facilities
Figure 8 - Primary Reasons for those Decreasing their number of Facilities (8 of 44)
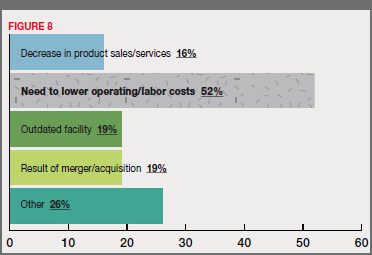
More than half of those decreasing their number of facilities over the past year say they needed to lower operating and/or labor costs - with only 16 percent saying the shuttering of facilities was due to a decrease in product sales.
Next: Figure 9 - Expect the Economy to Improve Significantly By
Figure 9 - Expect the Economy to Improve Significantly By (9 of 44)
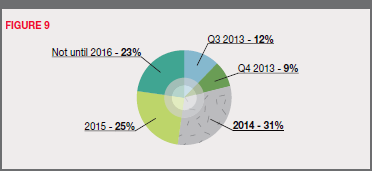
Almost half of the respondents to our 27th Annual Corporate Survey do not expect the U.S. economy to improve until 2015 or 2016.
Next: Figure 10 - Effects of the Sluggish Recovery on Facility Plans
Figure 10 - Effects of the Sluggish Recovery on Facility Plans (10 of 44)
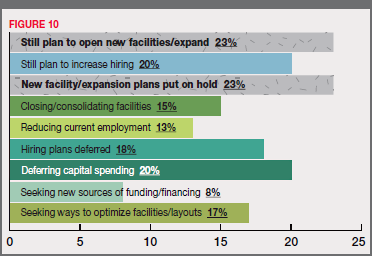
The Corporate Survey respondents also say the sluggish economic recovery has caused their firms to put new facilities and expansion plans on hold (23 percent) and reduce their current employment (13 percent) or defer hiring additional workers (18 percent).
Next: Figure 11 - Expect to Open New Facilities Within
Figure 11 - Expect to Open New Facilities Within (11 of 44)
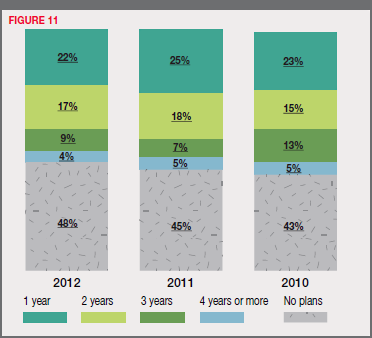
Another 13 percent have longer-range new facilities plans, and nearly half have no new facilities plans at all.
Next: Figure 12 - Of Those with New Facilities Plans, Number to be Opened within the Next Five Years
Figure 12 - Of Those with New Facilities Plans, Number to be Opened within the Next Five Years (12 of 44)
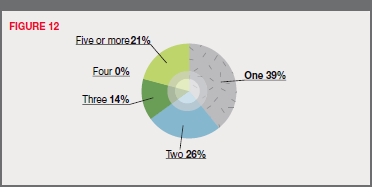
Of those with new facilities plans, remarkably, a fifth expect to open five or more facilities. However, another 39 percent expect to open just one new facility, and a quarter of the respondents expect to open two.
Next: Figure 13 - Location of New Domestic Facilities (as a percentage of total number to be opened)
Figure 13 - Location of New Domestic Facilities (as a percentage of total number to be opened) (13 of 44)
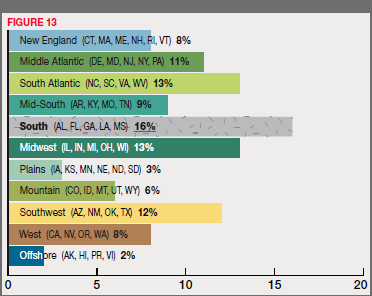
The South Atlantic region (North Carolina, South Carolina, Virginia, and West Virginia) and the Midwest (Illinois, Indiana, Michigan, Ohio, and Wisconsin) will each receive 13 percent of the respondents' planned new facilities, closely followed by the Southwest (Arizona, New Mexico, Oklahoma, and Texas) with 12 percent and the Mid-Atlantic States (Delaware, Maryland, New Jersey, New York, and Pennsylvania) with 11 percent.
Next: Figure 14 - Types of New Domestic Facilities (as a percentage of total number to be opened)
Figure 14 - Types of New Domestic Facilities (as a percentage of total number to be opened) (14 of 44)
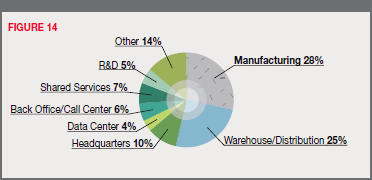
More than a quarter of the new domestic facilities planned by the current Corporate Survey respondents will house manufacturing operations, and another 25 percent will be warehouse/distribution centers.
Next: Figure 15 - Number of New Jobs to be Created at New Domestic Facilities
Figure 15 - Number of New Jobs to be Created at New Domestic Facilities (15 of 44)
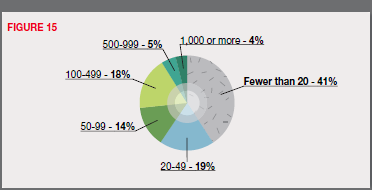
Unfortunately, three quarters of the respondents say their planned new facilities will create fewer than 100 new jobs, with only about a fifth of the respondents saying the facilities will create between 100 and 499 jobs.
Next: Figure 16 - Amount to be Invested in New Domestic Facilities
Figure 16 - Amount to be Invested in New Domestic Facilities (16 of 44)
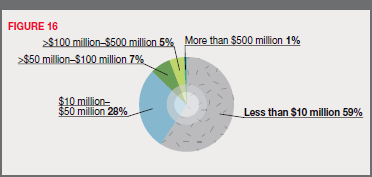
Additionally, about 60 percent of the Corporate Survey respondents say the planned new facilities will represent less than $10 million in investment; just 28 percent say they represent between $10 million and $50 million in investment.
Next: Figure 17 - Location of New Foreign Facilities (as a percentage of total number to be opened)
Figure 17 - Location of New Foreign Facilities (as a percentage of total number to be opened) (17 of 44)
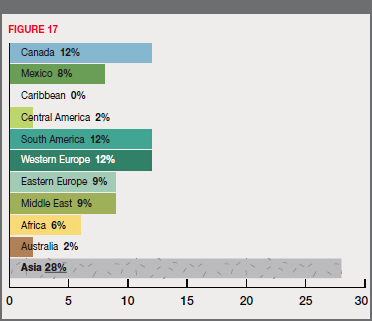
This year's Corporate Survey respondents appear to have as much interest in South America as in Canada and Western Europe - historically our readers' top two outward FDI choices. The survey respondents plan 12 percent of their new foreign facilities for each of these three regions.
Next: Figure 18 - Location of New Facilities Planned for Asia (as a percentage of total new Asian projects)
Figure 18 - Location of New Facilities Planned for Asia (as a percentage of total new Asian projects) (18 of 44)
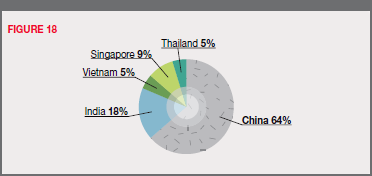
Year-over-year interest in Asia by the Corporate Survey respondents has declined somewhat. This year's survey respondents say 28 percent of their new foreign facilities are planned for Asia, down from 33 percent of those planned by the prior year's respondents. Two thirds of the new facilities planned for Asia will be in China.
Next: Figure 19 - Types of New Foreign facilities (as a percentage of total number to be opened)
Figure 19 - Types of New Foreign facilities (as a percentage of total number to be opened) (19 of 44)
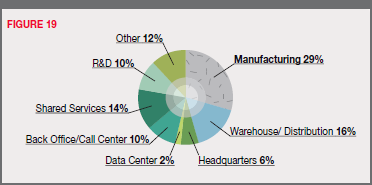
Nearly 30 percent of the planned new foreign facilities will house manufacturing operations, and there will be many more foreign back office/call center (10 percent of total projects) and shared services facilities (14 percent) than seen on the domestic front (10 percent in all).
Next: Figure 20 - Number of New Jobs to be Created at New Foreign Facilities
Figure 20 - Number of New Jobs to be Created at New Foreign Facilities (20 of 44)
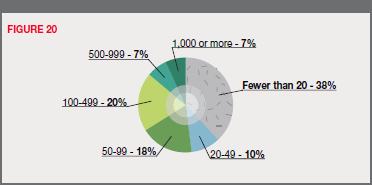
Additionally, about a third of the Corporate Survey respondents say their new foreign facilities will create more than 100 jobs - more than expected at the planned new domestic facilities. Investment expectations are similar, however.
Next: Figure 21 - Amount to be Invested In New Foreign Facilities
Figure 21 - Amount to be Invested In New Foreign Facilities (21 of 44)
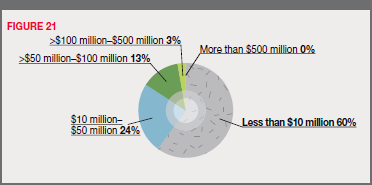
Sixty percent of the respondents say they will invest less than $10 million in new foreign facilities, and a quarter will invest between $10 million and $50 million.
Figure 22 - Expect to Expand existing Facilities at Present Location Within
Figure 22 - Expect to Expand existing Facilities at Present Location Within (22 of 44)
Half of the 27th Annual Corporate Survey respondents have no plans to expand facilities at their present locations — as was the case with the prior year's survey respondents. Just 35 percent say they expect to expand facilities over the next two years.
Next: Figure 23 - Number of New Jobs to be Created by Expansion
Figure 23 - Number of New Jobs to be Created by Expansion (23 of 44)
However, these expansions will not create many new jobs. More than 80 percent of those with expansion plans say their existing facility expansions will create fewer than 100 new jobs.
Next: Figure 24 - Expect to Relocate a Domestic Facility Within
Figure 24 - Expect to Relocate a Domestic Facility Within (24 of 44)
Seventy percent of the Corporate Survey respondents also have no relocation plans, with only a fifth expecting to relocate within the next two years
Next: Figure 25 - Of Those with Plans, the Primary Reasons for Moving from Current Location
Figure 25 - Of Those with Plans, the Primary Reasons for Moving from Current Location (25 of 44)
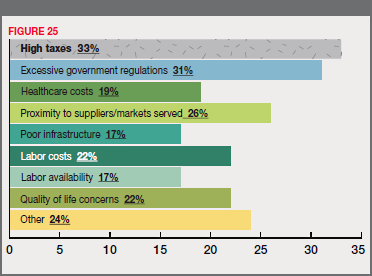
Of those with relocation plans, a third cite high taxes and excessive government regulations as their reasons for moving, while a quarter need to be in closer proximity to suppliers and/or markets served, and about a fifth are also concerned with healthcare costs and the quality of life at their present locations.
Figure 26 - Expect to Relocate a Domestic Facility to an Offshore Location
Figure 26 - Expect to Relocate a Domestic Facility to an Offshore Location (26 of 44)
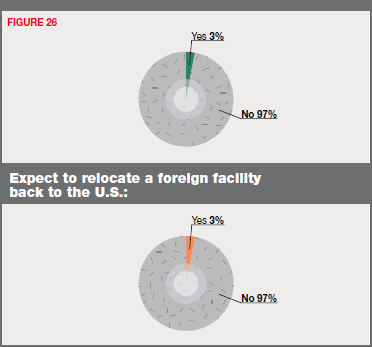
Nonetheless, only 3 percent of the Corporate Survey respondents expect to relocate a domestic operation to offshore or a foreign facility back to the United States
Next: Figure 27 - If So, Reasons for Re-Shoring
Figure 27 - If So, Reasons for Re-Shoring (27 of 44)
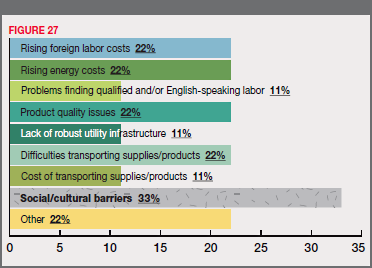
Of those who say they will re-shore, a third cite social/cultural barriers as their reasons for doing so, and a fifth are concerned about rising foreign labor and energy costs, product quality issues, and difficulties transporting supplies/products.
Next: Figure 28 - Issues Preventing Company from Spending More of Its Earnings on Investment in U.S. Facilities
Figure 28 - Issues Preventing Company from Spending More of Its Earnings on Investment in U.S. Facilities (28 of 44)
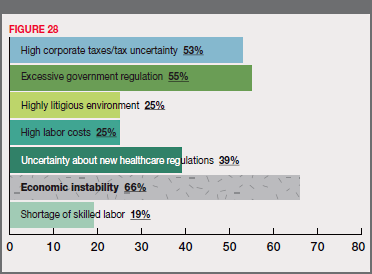
When asked about the issues preventing their companies from spending more of their earnings on investment in U.S. facilities, more than half of the respondents cite high U.S. tax rates/tax uncertainty and excessive government regulations; nearly 40 percent are also concerned about new healthcare regulations and, importantly, fully two-thirds are concerned about general economic instability
Next: Figure 31 - High Unemployment Rates are Making it Easier to Find the Necessary Labor
Figure 31 - High Unemployment Rates are Making it Easier to Find the Necessary Labor (29 of 44)
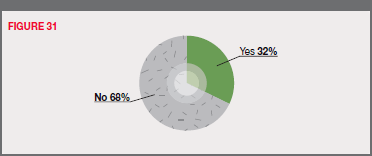
In a related question, we asked our survey-takers if the relatively high unemployment rates throughout the nation are making it easier for them to find the labor they need. More than two thirds say this is not the case.
Next: Figure 32 - Many Unemployed Are Lacking
Figure 32 - Many Unemployed Are Lacking (30 of 44)
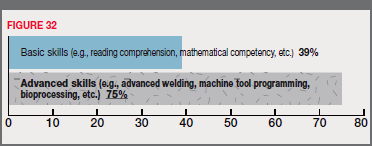
About two-fifths of the Corporate Survey respondents say the unemployed are lacking basic reading and math skills; 75 percent say that, most importantly, they are lacking the more advanced skills that the respondents require, e.g., advanced welding, machine tool programming, etc.
Next: Figure 33 - Dependency on Contract Workers or Contingent Labor
Figure 33 - Dependency on Contract Workers or Contingent Labor (31 of 44)
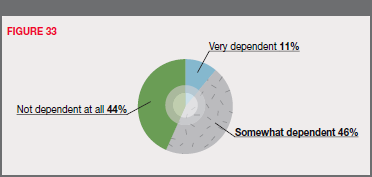
A lack of skilled labor may be the reason that 57 percent of the respondents say they are very or somewhat dependent on contract or contingent workers.
Next: Figure 34 - Percentage of Contract Labor Employed at Any Given Time
Figure 34 - Percentage of Contract Labor Employed at Any Given Time (32 of 44)
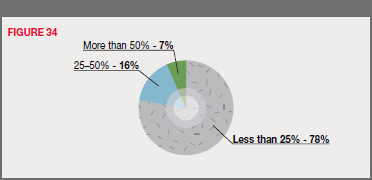
Although, at any given time, less than 25 percent of their work forces are comprised of contract labor, according to nearly 80 percent of the respondents.
Next: Figure 35 - Importance of the Existence of an available Building in the Site search
Figure 35 - Importance of the Existence of an available Building in the Site search (33 of 44)
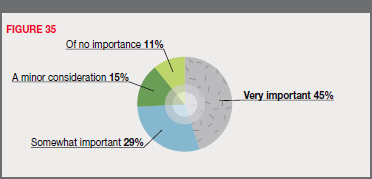
This factor jumped in the rankings from fifteenth place in the year-prior survey to eighth place this year - the second- largest jump in the rankings - considered "very important" or "important" by 78.4 percent of the respondents.
Next: Figure 36 - Importance of the Existence of a Shovelready/ Pre-Certified Site
Figure 36 - Importance of the Existence of a Shovelready/ Pre-Certified Site (34 of 44)
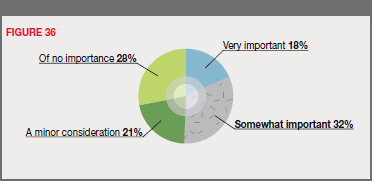
Moreover, when they are looking for available land for construction, 50 percent of our Corporate Survey respondents consider the existence of a shovel-ready or pre-certified site as very or somewhat important
Next: Figure 37 - Impact of High Energy Costs on Facility Plans
Figure 37 - Impact of High Energy Costs on Facility Plans (35 of 44)
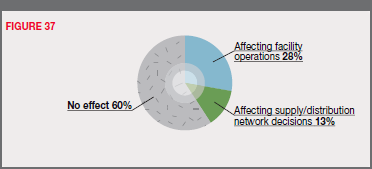
Energy availability and costs is ranked sixth among the factors, considered "very important" or "important" by 81.3 percent of the Corporate Survey respondents. It is hard to explain, therefore, why 60 percent of the respondents say energy costs are having no impact on their facility operations or supply/distribution networks.
Next: Figure 38 - Sustainable Development is More Important Now than in the Past:
Figure 38 - Sustainable Development is More Important Now than in the Past (36 of 44)
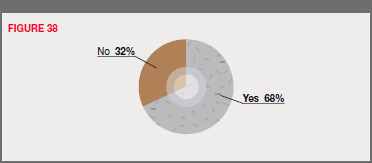
Nonetheless, 68 percent of the respondents say sustainable development is more important to their company now than in the past.
Next: Figure 39 - Measures Being Undertaken to Reduce Company's "Carbon Footprint"
Figure 39 - Measures Being Undertaken to Reduce Company's "Carbon Footprint" (37 of 44)
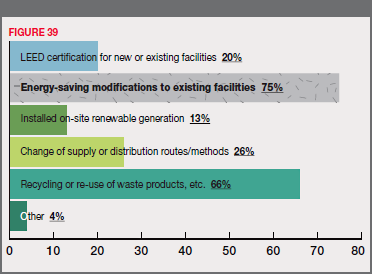
Three quarters of the respondents are making energy-saving modifications to their facilities, while two thirds are recycling or re-using waste products.
Next: Figure 40 - Company has Received and Utilized Incentives in the Past
Figure 40 - Company has Received and Utilized Incentives in the Past (38 of 44)
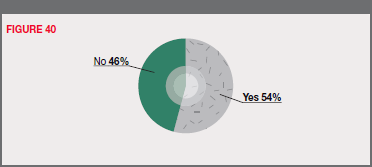
Only slightly more than half of the respondents say they have received and utilized incentives in the past
Next: Figure 41 - If so, Percentage of the Incentives Initially Estimated Value Secured
Figure 41 - If so, Percentage of the Incentives Initially Estimated Value Secured (39 of 44)
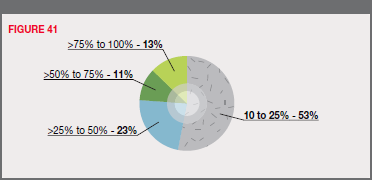
Of those, three quarters say they have only secured up to 50 percent of the incentives estimated value.
Next: Figure 42 - Company has had to Repay Incentives Monies because Investment and/or Job Creation Obligations Were not Met
Figure 42 - Company has had to Repay Incentives Monies because Investment and/or Job Creation Obligations Were not Met (40 of 44)
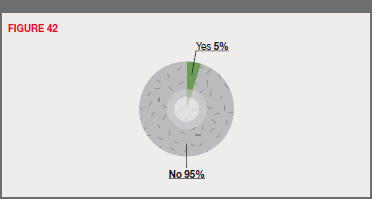
Only 5 percent have had to repay incentives monies because investment or job creation obligations were not met.
Next: Figure 43 - Types of Incentives Considered Most Important When Making a Location Decision
Figure 43 - Types of Incentives Considered Most Important When Making a Location Decision (41 of 44)
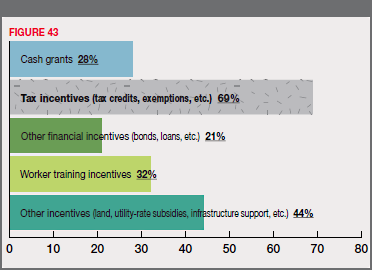
When considering all types of incentives, more than two thirds of the respondents believe tax incentives are the most important type, while nearly half also prefer miscellaneous incentives such as free land, utility-rate subsidies, and infrastructure support.
Next: Figure 44 - Importance of Incentives to a Project Moving Forward in a Particular Location
Figure 44 - Importance of Incentives to a Project Moving Forward in a Particular Location (42 of 44)
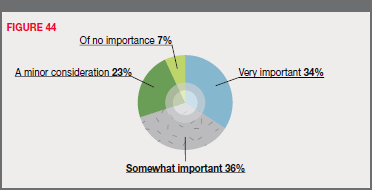
Seventy percent of the respondents also feel that incentives can be important to moving a project forward in a specific location.
Next: Figure 45 - Communities are Offering Specific Incentives for "Green Initiatives"
Figure 45 - Communities are Offering Specific Incentives for "Green Initiatives" (43 of 44)
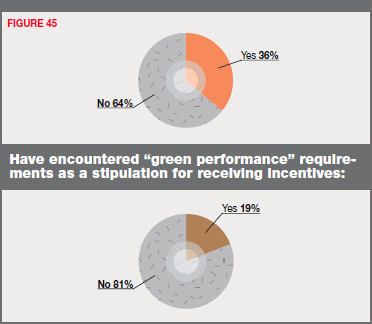
Approximately 80 percent of the respondents also confirm they have not encountered any "green performance" requirements as a stipulation for receiving incentives.
Next: Figure 46 - Existence of Businesses Performing Similar Activities in the Area of search is Taken Into Consideration
Figure 46 - Existence of Businesses Performing Similar Activities in the Area of search is Taken Into Consideration (44 of 44)
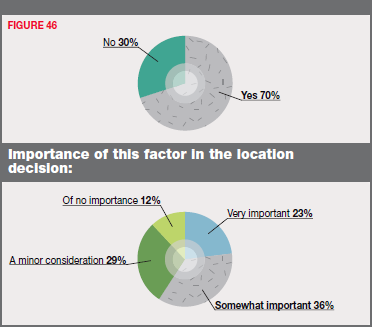
Seventy percent of the respondents say they take into consideration the existence of businesses performing similar activities to theirs in the area of search.
Although the U.S. economy was growing at a healthy 3.1 percent rate in the summer of 2012, the Commerce Department reports there was a 0.1 percent contraction in the year’s final quarter — the first decline since the end of the recession in 2009. Some analysts say the slowdown was caused by Superstorm Sandy, which resulted in a cessation of exports and inventory growth along the East Coast. Others say that the impending “fiscal cliff” with its predicted government spending cuts and tax increases was to blame.
Overall, 2012 GDP growth registered 2.2 percent, up from 1.8 percent in 2011. And there was also a 2.2 percent annualized gain in consumer spending, an 8.8 percent increase in business investment, and a remarkable 15.4 percent jump in housing investment, according to Commerce Department reports. How did manufacturers fare in 2012? The Institute for Supply Management (ISM) reports that manufacturers experienced uneven growth through much of 2012, with a weak global economy dampening exports. Nonetheless, as the year drew to a close, the ISM index of manufacturing activity jumped to 50.2 (seasonally adjusted) in December, indicating expansion, which we are now continuing to see in 2013. Also, orders for durable goods surged 4.6 percent in December 2012, although net manufacturing employment was relatively flat.
Area Development’s survey of our corporate executive readers was conducted in late fall, however, just as the effects of Superstorm Sandy were being felt and talks of the impending “fiscal cliff” were heating up. Those events may have had some effect on our readers’ survey responses. Let’s examine the survey results to see what, if any, effect these end-of-year events had on our readers’ location and expansion plans and priorities.


 Survey Results Point to a "Positive Hold"
Brett Hunsaker, executive vice president and regional managing director at Newmark Grubb Knight Frank
 Emergence of Big Data Affects Corporate Survey Respondents' Priorities
Bill Luttrell, senior locations strategist at Werner Enterprises


 Corporate Survey Results Mirror General Market Trends
Christopher B. Schastok, vice president at Jones Lang LaSalleg

 Corporate Survey Reflects the New Economic Normal
Thomas Stringer, Business Advisory Services, Ryan & Company
There were more than 200 responses to our 27th Annual Corporate Survey of our readers, conducted in the fall of 2012. Nearly 90 percent of these individuals responded online — a sign of the ever-increasing use/power of the Internet. Forty percent of the respondents are with manufacturing companies, 9 percent represent logistics/distribution/warehousing establishments, and 10 percent are with construction and engineering enterprises (Figure 1).
Importantly, 40 percent of the survey respondents are also the head of their companies, i.e., president, CEO, owner, etc. And another fifth are financial or other corporate officers (Figure 2). Nearly half of the respondents say they are responsible for their companies’ final location decisions, and another 38 percent make the preliminary recommendations (Figure 3).
About a third of the respondents to the 27th Annual Corporate Survey say they operate just one domestic facility, and only slightly more than a third operate five or more domestic facilities. However, more than half of the respondents say they operate 5 or more foreign facilities, with another 29 percent claiming to operate just one foreign facility (Figure 4).
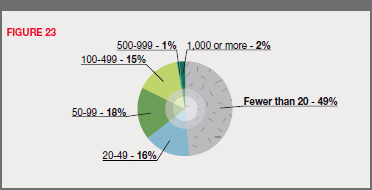
Nearly 30 percent of the Corporate Survey respondents say their firms employ 1,000 or more people worldwide. A quarter are mid-sized in terms of employment, with 100–499 workers, and about a fifth of the respondents say their work forces are comprised of fewer than 20 individuals (Figure 5). Nearly 30 percent of the respondents to the 27th Annual Corporate Survey say they have increased their number of facilities over the past year, while 10 percent say they have decreased their number of facilities, and 60 percent of the respondents have not changed their number of facilities at all (Figure 6) — results that are remarkably consistent with the year prior’s Corporate Survey.
Nearly half of the respondents who say they have increased their number of facilities needed to increase production in response to increased sales, and nearly a third needed better access to markets (Figure 7). Interestingly, more than half of those decreasing their number of facilities over the past year say they needed to lower operating and/or labor costs — with only 16 percent saying the shuttering of facilities was due to a decrease in product sales (Figure 8).
Respondents’ New Facilities Plans
Almost half of the respondents to our 27th Annual Corporate Survey do not expect the U.S. economy to improve until 2015 or 2016 (Figure 9). The Corporate Survey respondents also say the sluggish economic recovery has caused their firms to put new facilities and expansion plans on hold (23 percent) and reduce their current employment (13 percent) or defer hiring additional workers (18 percent) (Figure 10).
In fact, consistent with the prior year’s Corporate Survey results, just 22 percent of the respondents expect to open new facilities within one year, and 17 percent within two years. Another 13 percent have longer-range new facilities plans, and nearly half have no new facilities plans at all (Figure 11). Of those with new facilities plans, remarkably, a fifth expect to open five or more facilities. However, another 39 percent expect to open just one new facility, and a quarter of the respondents expect to open two (Figure 12).
When it comes to the location of new domestic facilities, the South (Alabama, Florida, Georgia, Louisiana, and Mississippi) will garner the most new facilities planned by the respondents to our 27th Annual Corporate Survey — 16 percent. The South Atlantic region (North Carolina, South Carolina, Virginia, and West Virginia) and the Midwest (Illinois, Indiana, Michigan, Ohio, and Wisconsin) will each receive 13 percent of the respondents’ planned new facilities, closely followed by the Southwest (Arizona, New Mexico, Oklahoma, and Texas) with 12 percent and the Mid-Atlantic States (Delaware, Maryland, New Jersey, New York, and Pennsylvania) with 11 percent (Figure 13). It should be noted that in the prior year’s Corporate Survey, the largest share of the respondents’ planned new facilities were to be in the Southwest (15 percent), which outpaced all other regions by a wide margin. More than a quarter of the new domestic facilities planned by the current Corporate Survey respondents will house manufacturing operations, and another 25 percent will be warehouse/distribution centers (Figure 14).
Unfortunately, three quarters of the respondents say their planned new facilities will create fewer than 100 new jobs, with only about a fifth of the respondents saying the facilities will create between 100 and 499 jobs (Figure 15). Additionally, about 60 percent of the Corporate Survey respondents say the planned new facilities will represent less than $10 million in investment; just 28 percent say they represent between $10 million and $50 million in investment (Figure 16). This year’s Corporate Survey respondents appear to have as much interest in South America as in Canada and Western Europe — historically our readers’ top two outward FDI choices. The survey respondents plan 12 percent of their new foreign facilities for each of these three regions (Figure 17). The prior year’s survey respondents had planned 20 percent of their new foreign facilities for Western Europe, 10 percent for Canada, and just 7 percent for South America. (In fact, in an interesting shift, FDI inflows to all of Latin America have been rising.)
Year-over-year interest in Asia by the Corporate Survey respondents has declined somewhat. This year’s survey respondents say 28 percent of their new foreign facilities are planned for Asia, down from 33 percent of those planned by the prior year’s respondents. Two thirds of the new facilities planned for Asia will be in China (Figure 18).
Nearly 30 percent of the planned new foreign facilities will house manufacturing operations, and there will be many more foreign back office/call center (10 percent of total projects) and shared services facilities (14 percent) than seen on the domestic front (10 percent in all) (Figure 19). Additionally, about a third of the Corporate Survey respondents say their new foreign facilities will create more than 100 jobs (Figure 20) — more than expected at the planned new domestic facilities. Investment expectations are similar, however. Sixty percent of the respondents say they will invest less than $10 million in new foreign facilities, and a quarter will invest between $10 million and $50 million (Figure 21).
Respondents’ Plans to Expand or Relocate
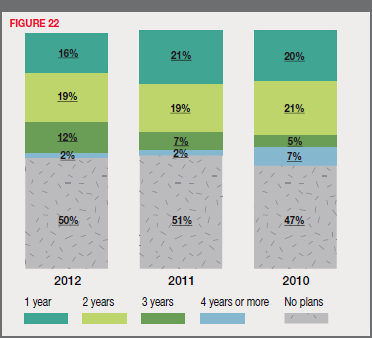
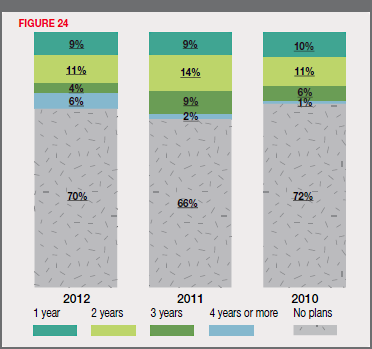
Half of the 27th Annual Corporate Survey respondents have no plans to expand facilities at their present locations — as was the case with the prior year’s survey respondents. Just 35 percent say they expect to expand facilities over the next two years (Figure 22). However, these expansions will not create many new jobs. More than 80 percent of those with expansion plans say their existing facility expansions will create fewer than 100 new jobs (Figure 23). Seventy percent of the Corporate Survey respondents also have no relocation plans, with only a fifth expecting to relocate within the next two years (Figure 24). Of those with relocation plans, a third cite high taxes and excessive government regulations as their reasons for moving, while a quarter need to be in closer proximity to suppliers and/or markets served, and about a fifth are also concerned with healthcare costs and the quality of life at their present locations (Figure 25).
Nonetheless, only 3 percent of the Corporate Survey respondents expect to relocate a domestic operation to offshore or a foreign facility back to the United States (Figure 26). Of those who say they will re-shore, a third cite social/cultural barriers as their reasons for doing so, and a fifth are concerned about rising foreign labor and energy costs, product quality issues, and difficulties transporting supplies/products (Figure 27). When asked about the issues preventing their companies from spending more of their earnings on investment in U.S. facilities, more than half of the respondents cite high U.S. tax rates/tax uncertainty and excessive government regulations; nearly 40 percent are also concerned about new healthcare regulations and, importantly, fully two-thirds are concerned about general economic instability (Figure 28).
Next: Respondents Rank the Factors