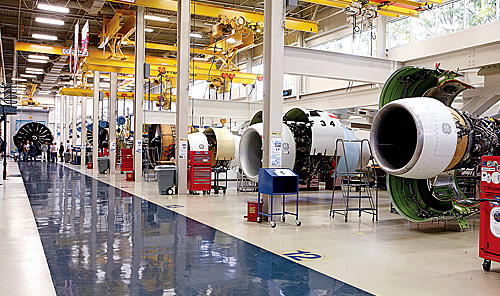
Even more than 2021, 2022 was a year of partial recovery for civil aviation manufacturers after the 2020 pandemic-driven plunge that interrupted a decade of seemingly inexorable growth. Still, a full return to pre-COVID 19 output levels appears to be some way off. Stubborn supply chain challenges and labor shortages continue to hinder many leading OEMs as they strive to fulfill a slew of new orders from carriers seeking to expand, rejuvenate, and/or green their fleets.
Meanwhile, the trajectory of the global defense industry for perhaps a decade to come is likely to be unprecedented growth. Total global military spending in 2021 surpassed the $2 trillion mark for the first time,3 rising to USD $2.113 trillion. Driven by geopolitical conflicts, an era of sustained, elevated demand in military aerospace production appears to have arrived.
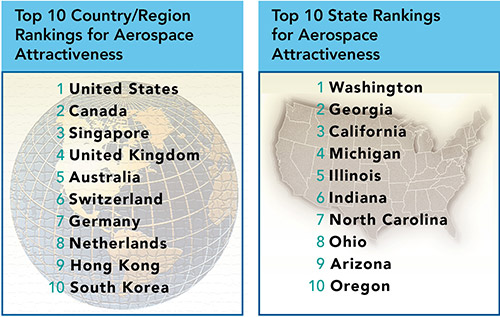
For the ninth year in a row, PwC’s 2022 Aerospace Manufacturing Attractiveness Rankings report analyzes the key states and countries leading the A&D industry. We select metrics and data with an eye to helping companies find the optimal places to invest, build, expand, consolidate, or relocate their operations. The report can be a helpful tool in planning for production, enhancing the resiliency and transparency of manufacturing supply chains, and rebalancing cost structures.
We continue to refine our rankings methodology, in part by increasing the number of metrics included. Our 2022 state and country rankings are based on 41 and 38 metrics, respectively. As the accompanying charts indicate, these are distributed across the same categories for both states and countries, except that geopolitical risk is excluded from the state rankings, being essentially identical for all states.
What states and countries might A&D companies best consider as they seek to fulfill their long-term production strategies? Overall, this year’s rankings reveal impressive resilience in the U.S. domestic A&D industry (including space) in the face of both expected and unexpected market changes. This picture contrasts with a rapidly evolving investment landscape across the global civil and military aviation manufacturing industries as they strive to respond to an economy drastically altered by war in Europe and ongoing pandemic-related challenges.
While aerospace manufacturing capacity can take years to build, our rankings suggest that leading A&D companies will be those that remain agile as the sector continues to rebound and grow. Many could emerge altered and even enhanced from the current phase of industry-wide transition.
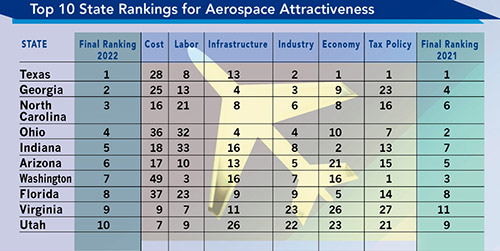
State Rankings for Aerospace Manufacturing Attractiveness
This year’s state ratings emphasize the resilience of U.S. civil aviation manufacturing, despite the demand and supply-chain shocks of the COVID-19 era and the uncertainties of the recent inflationary period. The need for workforce development — growth, diversification, education and (re-) training — and the efforts under way to address that need also emerge strongly this year as themes in many states.
This year’s top-five states are all perennial leaders — all ranked in last year’s top 10, as all five have done since 2016. In fact, our top-10 lists for 2020 and 2021 include the same states in an only slightly reshuffled order, with two exceptions: Virginia notches up to 9th place from 11th in 2020, while last year’s 10th-place Kansas drops to 21st, with a plunge in its infrastructure metric from 2nd to 25th place (which the launch in mid-2022 of the Kansas Infrastructure Hub might soon restore).
Texas, never below the top four in our survey since its inception, holds its 2020 top spot this year, also coming in first, notably, for economy and tax policy. Georgia, which has placed in the top four in our ranking since 2015, lands in a strong 2nd. North Carolina, a top-10 finisher in our rankings in seven of the last eight years, reaches the number three spot, its best showing ever, with improvements in cost and infrastructure. Ohio, in our top nine since 2014 and our top three since 2016, slips slightly to 4th place, with a less robust showing for labor, economy, and tax policy. Indiana has cruised into a slot ranging from 5th to 8th place in each of the last seven years and regains 5th place, where the state last landed in 2017; a major factor is improvement in cost — up to 18th from 28th place last year.
This year’s top-five states are all perennial leaders. All ranked in last year’s top 10, as all five have done since 2016. Below the top five, it is worth pointing out that while the aerospace sector has boomed in Florida for years, the state faces capacity challenges and stiff competition from other states. While Florida is well known for the diversity of its burgeoning A&D sector, recent public- and private-sector emphasis on workforce growth (as distinct from scale of investment or production) as a sector target is a promising development — and one that other states might emulate.
Considerations for your business: States with well-developed supply networks to the U.S. military, especially those that have invested in R&D capability enhancement in recent years, could expect strong growth in 2023 and beyond. Competition among top states to attract space-sector investment and green aviation startups reveals a growing emphasis on public-private collaborations and the development of new technologies that cross boundaries among the civil, defense, and space areas. And the urgent priority to decarbonize all aspects of flight ensures that, while it is hard to predict which technologies will take the lead, the pace of change is likely to accelerate.
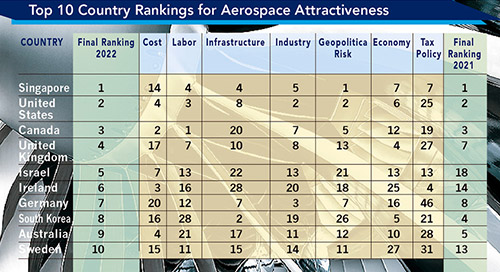
Our country rankings this year suggest a global aerospace industry in a state of flux — no surprise, given the complexity of doing business in the phase of late-pandemic recovery. Across civil aviation, in both pax and cargo, patterns of traffic and leasing remain shifting and unsettled, which affects manufacturing demand.
Singapore, which has never ranked below third place in our survey, tops our list this year once more with a significant uptick in our metric for geopolitical risk (to 1st place from 12th) and despite dropping from 3rd to 14th place in cost.
In the U.S. in 2021, the A&D sector continued to support nearly two million jobs. The U.S. A&D market, second in our rankings this year, is expected to grow from $700.3 billion in 2021 to $755.24 billion by the end of 2022 (i.e., at a CAGR of 7.8 percent) and to reach $1047.07 billion?in 2026 (CAGR of 8.5 percent). It is likely that A&D will recapture its status as the United States’ leading net exporter. The CHIPS Act, passed in 2022, constitutes a major effort to secure U.S. microchip supply chains and is likely to have significant consequences for U.S. A&D.
Canada holds its 2020 bronze medal this year, shooting up from 36th to 12th place for economy, while ranking number one in labor for the third year in a row. 2021 saw big news in military procurement as Canada announced the commitment of CDN $5 billion over six years to comprehensively modernize the badly aging systems of the North American Aerospace Defense Command (NORAD). Canada’s long-anticipated announcement of a new Indo-Pacific strategy to confront Chinese military and cyber threats will also likely lead to increased military spending.
The UK climbs from its 2021 10th spot to 4th this year, with improvement in our metrics for economy (from 13th to 4th) and cost (from 29th to 17th), owing in part to the pound’s recent weakness. In Brexit’s aftermath, the UK is actively encouraging foreign investment, and acute and persistent backlogs for British suppliers in Tier 2 A&D and below could widen prospects for new market entrants to increase capacity and simplify local supply chains.
The U.S. A&D market is currently expected to reach $1047.07 billion in 2026. Israel jumped to 5th place this year — its highest ranking ever, and up from 18th in 2021 — on the strength of significant growth in cost, labor, industry, and geopolitical risk. Israel’s defense-heavy A&D industry is the inverse of Canada’s civil-dominated sector. Last year saw a gigantic boost in Israeli weapons exports, which hit a record $11.3 billion in 2021 (a 33 percent increase over 2020), largely as a result of the Abraham Accords.
Farther down in our top 10, Ireland has landed 12th to 14th in our rankings in every year but one since 2014. This year’s impressive rise to 6th place reflects improvements in metrics for cost, labor, and geopolitical risk — reflecting Ireland’s relative political stability and economic resilience (compared to many other European nations in current wartime conditions) and its favorable investment and trade climate (compared to uncertainties in the post-Brexit UK).
Considerations for your business: This year’s survey results suggest that, while every sector of the global A&D industry is ever more globalized, securing the reliability, resiliency, and transparency of manufacturers’ supply networks has never been more critical. Strong collaborative relationships remain a key to success on a regional and global scale, as does support by investors of local training and education pipelines.
Context and a Caveat: Our Rankings’ Methodology
We believe that our report is a useful tool that companies can use as a framework to help them evaluate investment decisions and as a guide for strategic planning. Still, we emphasize that any methodology is imperfect. For example, there is no consistent data available for skilled manufacturing, a priority for the aerospace industry; however, we have been able to include metrics for ISO 9100 certifications in our state data since 2020. Note too that the data underlying our metrics dates from 2021, while our framing analysis incorporates new developments through early January 2022. And, of course, interpretations of our rankings should always be tailored to each company’s specific circumstances.