The effective tariff rate as of the first half of 2025 is currently approximately four times higher compared to the historical quarterly average during the 30-year period from 1995–2024. Countries across APEC, a region that contributes over two-thirds of U.S. imports annually, face high tariff rates despite negotiated trade deals that are already in place. For example, countries like Brunei and Singapore, with no trade deals in place, face a 25 percent rate (reciprocal for the former and secondary for the latter). South Korea, despite having a trade deal, still faces a 15 percent tariff rate.
The effects of such trade policy on final goods in retail are quite direct: higher prices cause consumers to pull back spending, dampening possibly not just short-term demand but also long-term demand depending on the duration of current trade policy. This dynamic could cause brick-and-mortar retailers to rethink their space needs if they believe depressed demand will last for an extended period of time. The effects on industrial commercial real estate, however, are perhaps less obvious. Nevertheless, the passthrough mechanism between goods demand and space demand for these two property types is now increasingly similar. Even with trade deals and exemptions, industrial properties in the U.S. have felt the effects.
Some coastal markets are seeing performance deterioration far above national averages.
Generally speaking, broad macroeconomic headwinds have led to sharp increases in warehouse and distribution vacancies, plateauing rent growth, and net negative absorption in many markets. Tariffs have only added to the strain, as warehouse and distribution space demand depends on storage and delivery demand for both intermediate goods and final goods. While causation related to tariffs is too strong of a conclusion, there is clear correlation. Some West Coast markets have experienced performance deterioration that significantly exceeds that of the national average. For example, while the U.S. has only seen a 50-basis-point increase in the warehouse and distribution vacancy rate year-over-year (see Figure 1), Los Angeles and Oakland–East Bay both exceeded 100-basis-point increases in the same metric even though inventory growth for both metros was below that of the national figure. However, other markets (e.g., San Diego and San Francisco) are on par or even show lower year-over-year vacancy rates, indicating a tightening market with sufficiently robust demand even with inventory growth that exceeds the national number, as is the case for San Diego. This pattern extends beyond the West Coast. Port cities along the East Coast whose daily tonnage is often skewed toward international cargo, like Philadelphia, are also feeling the impact.
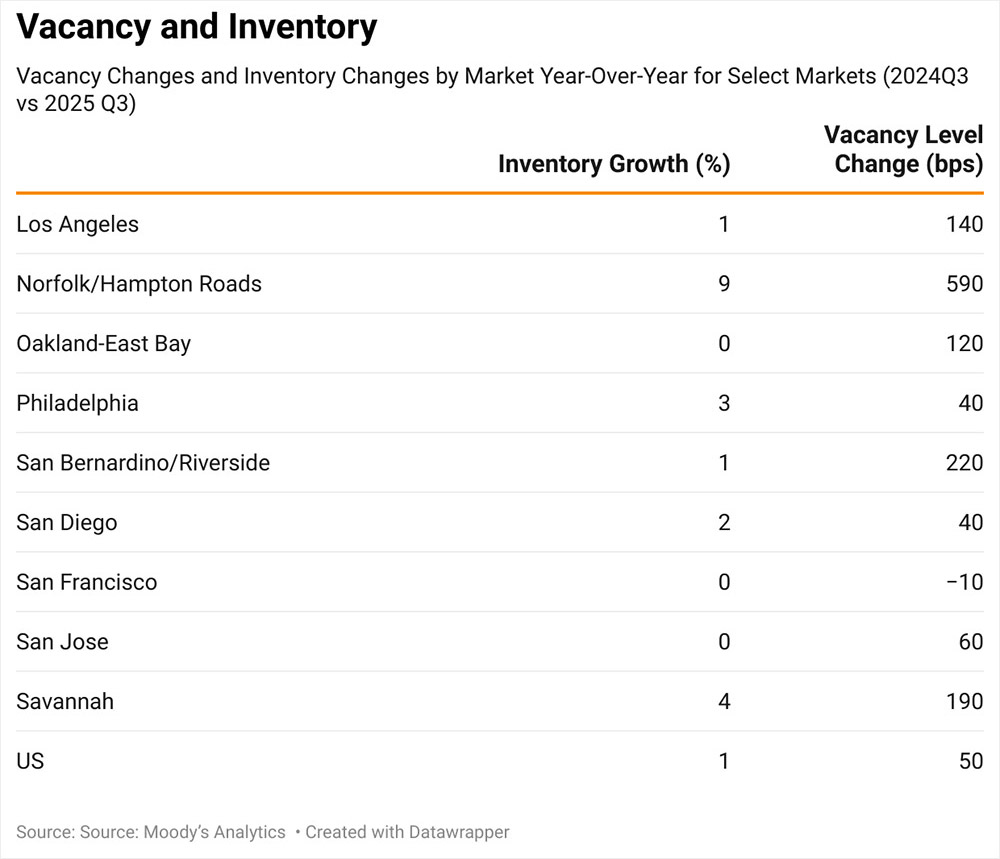
Still, tariffs are only one factor behind weakening warehouse and distribution performance. In many cases, higher vacancy rates, and the accompanying weakness in rent growth, are more directly attributable to the amount of speculative square footage that has come online, despite a general slowdown in the new-supply pipeline nationally. Norfolk/Hampton Roads and Savannah are two prime examples as both markets have experienced outsized inventory growth year-over-year.
Flex and R&D space remain more insulated even as other industrial subtypes soften.
Two major headwinds for warehouse and distribution demand growth persist, both tied to final consumer goods spending: weak consumer sentiment over elevated inflation expectations, and the interaction between interest rates and borrowing costs, which has contributed to the plateauing of e-commerce growth.
The University of Michigan Index of Consumer Sentiment shows rapidly declining confidence. The November 2025 reading stands at 50.3 — just shy of the record low of 50.0 in July 2022 — as consumers worry about food and goods prices this holiday season. Much of that concern relates to inflation that has yet to meaningfully reach the policy target. Meanwhile, over the past four quarters of data, from the third quarter of 2024 to the second quarter of 2025, e-commerce’s share of retail sales has held steady, just above 16 percent, oscillating between 16.1 percent and 16.3 percent. The record high of 16.3 percent, first reached in the second quarter of 2020, was only matched again in the second quarter of 2025.
4
Flex and research and development (R&D) properties have been a notable exception to such deteriorating performance. As their name implies, they provide more flexibility. From retail to office space to warehousing for smaller enterprises, flex space provides a more dynamic environment and a smaller footprint for businesses to scale up or down with ease. Thus, although this industrial subtype has been far more insulated, data from the second half of 2025 is starting to indicate a softening due to this intermingling of uses and blurring of lines, given the agglomeration of the aforementioned macroeconomic factors.
Tariffs have added strain to warehouse demand even as broader economic forces drive vacancies higher.
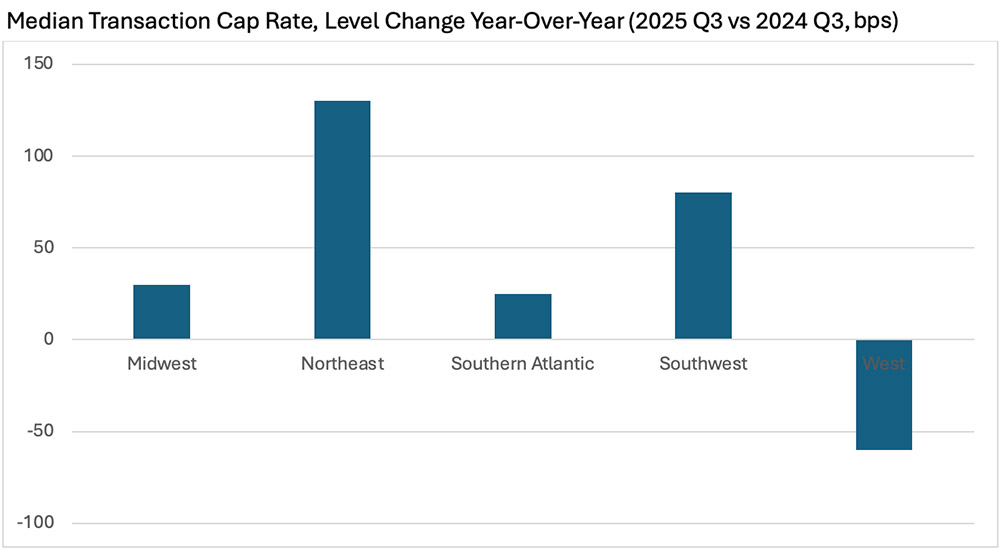
Turning to activity in the capital markets for the warehouse and distribution subsector, transaction volume has picked up year-over-year in the West, both by nominal dollar amount and property count. While activity remains more muted than years past, transaction volume is up 17 percent from the third quarter of 2024 to the third quarter of 2025 and the median transaction cap rate is down 60 basis points over the same time period even though the 10-year Treasury yield increased by 30 basis points. The other regions of the country have not been as lucky, with either declining transaction volumes or increasing cap rates, or both. However, the South Atlantic, the only other region to experience an increase in transaction volume over the aforementioned period, saw median transaction cap rates increase just 25 basis points, on par with the 10-year Treasury yield, meaning that the risk premium over the risk-free rate remained unchanged.
Although demand softening has led to a sharp deceleration in the amount of square footage completing over the past year, as well as square footage under construction, investor appetite for existing properties remains strong. Sizeable industrial portfolios are trading across the country, with particular investor interest in newer construction that offers features like higher ceiling clearance and advanced automation capabilities. Despite ongoing concerns regarding valuations due to the current interest-rate and Treasury-yield environment, in the wake of slowing, and in some pockets, stagnant, net operating income growth, industrial portfolios are finding access to capital with loans issued for new purchases and refinancing.
This resilience is largely due to minimal borrower distress across the industrial sector. Delinquency rates remain low (the lowest across all of the core property types) — just 1.5 percent as of September 2025 — indicating temporary headwinds rather than a long-term downward trend.