
Each year, Area Development partners with Chmura Economics & Analytics to evaluate the performance of U.S. metropolitan areas based on the fundamentals that matter most to business expansion: workforce, economic strength, and adaptability. Using Chmura’s data-driven model — which equally weights Prime Workforce and Economic Strength — the Leading Metro Locations rankings offer a snapshot of where growth, talent, and opportunity intersect.
The 2025 results confirm a national realignment in progress. Smaller and mid-size markets are outperforming their larger counterparts, buoyed by agile workforces, rising investment, and livability advantages that big metros increasingly struggle to match.
“Scale alone isn’t what drives competitiveness anymore,” says Chris Chmura, founder and CEO of Chmura Economics & Analytics. “The regions that perform best are the ones optimizing for their workforce and quality of place — not just their population size.”
National Trends: A Shift in the Map of Competitiveness
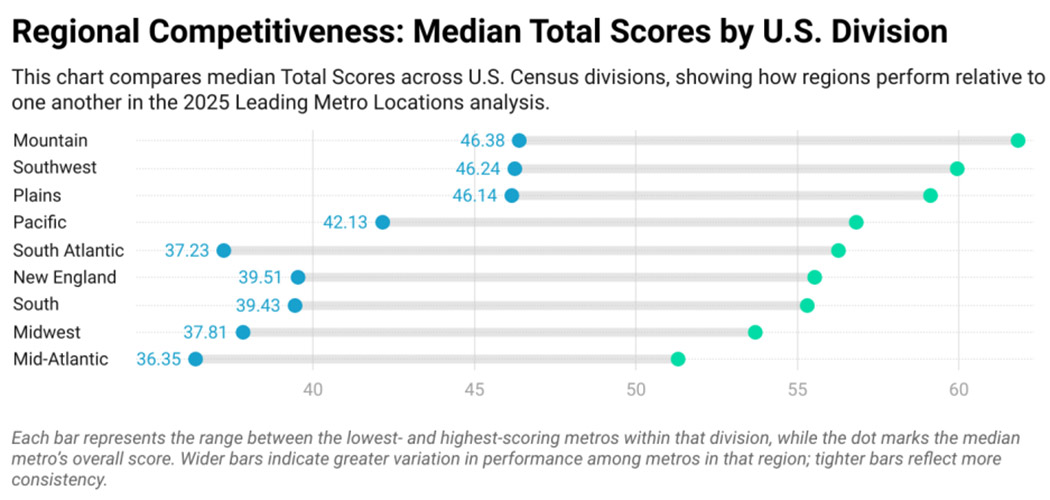
The Mountain and Southwest divisions once again lead the nation in total scores, followed closely by portions of the South Atlantic and Midwest. According to Chmura’s analysis, those gains reflect a combination of population inflows, affordable cost structures, and strong prime-age workforce participation.
“While we don’t directly track migration,” Chmura explains, “you can see its effects in the data — higher workforce participation, rising wages, and strong business formation across the Mountain West and Sun Belt.”
Texas stands out as the top-performing state by breadth, with 68 regions represented across all categories. Other consistent leaders include Utah, Georgia, and Indiana — states that have invested heavily in workforce systems and logistics infrastructure.
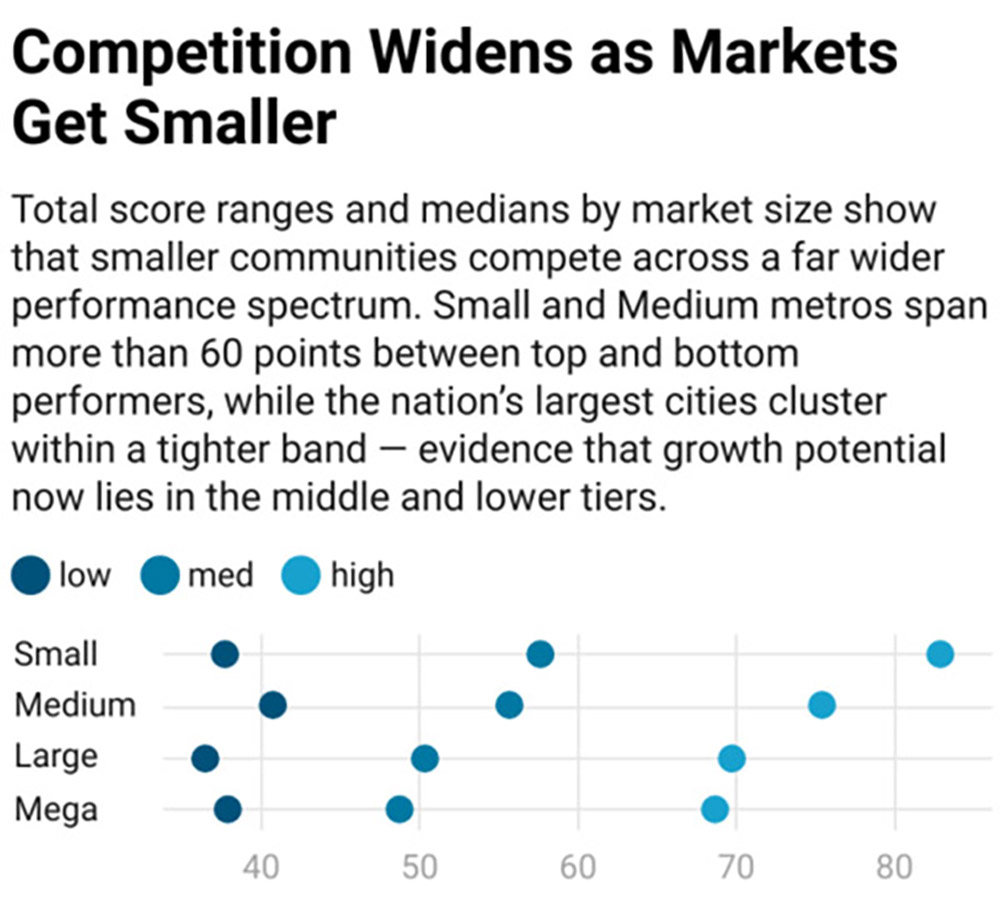
The biggest insight, however, lies in the data’s variability. Smaller and mid-size metros show performance spreads exceeding 50 points, while large metros cluster within roughly 25. That pattern reveals a U.S. economy where dynamism and differentiation increasingly belong to smaller places.
“The resurgence of smaller cities isn’t accidental — it’s driven by a new balance of affordability, access to amenities, connectivity, and opportunity. These communities, often on the fringes of major metros, are redefining what it means to live well and work smart. For younger tech workers in particular, they represent the promise of a vibrant career and a higher quality of life without the high-cost trade-offs of big-city living,” said Courtland Robinson, Director of Business Developmentat at Brasfield & Gorrie.
Prime Workforce: Small Places, Strong Talent
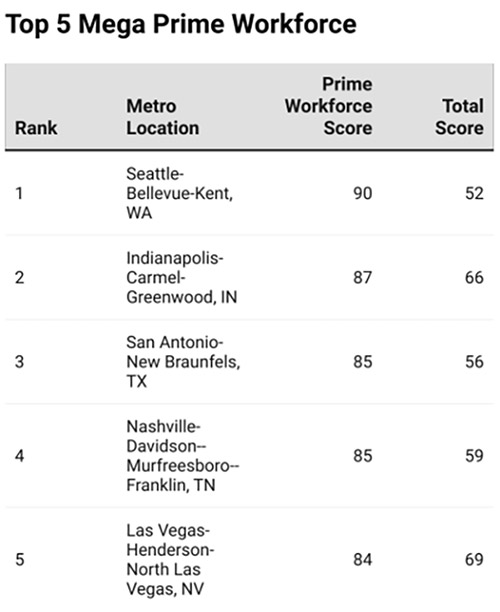
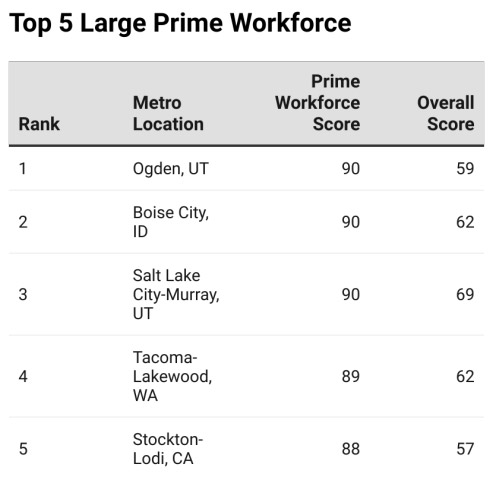
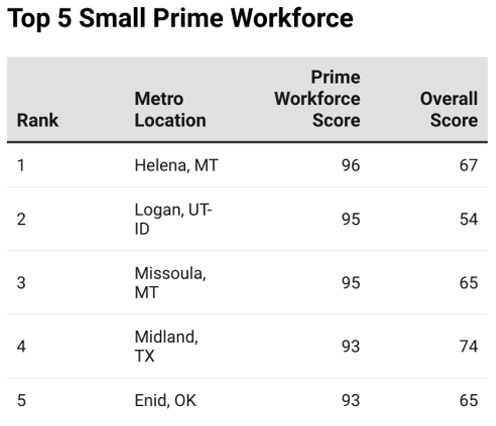
The Prime Workforce rankings tell a different story than overall competitiveness. While Texas and the Southeast dominate the Economic Strength lists, many of this year’s top performers for workforce quality are smaller, inland communities across the Mountain West and Pacific Northwest.
Laramie, WY; Vernal, UT; and Helena, MT lead the 2025 list, each posting near-perfect scores thanks to high concentrations of STEM employment, wage growth, and strong participation among prime-age workers. These regions prove that workforce quality doesn’t scale linearly with population. Many of the best-performing labor markets are those that have invested heavily in education pipelines, upskilling programs, and automation readiness despite their smaller size.
“As labor becomes scarce and land prices rise in major metros, the smart move isn’t necessarily going bigger — it’s going smaller and smarter. Companies are using micromarkets is proximity to major markets to create a regional spoke-and-hub networks, leveraging lower costs, higher incentives, and proximity without premium pricing,” said Joe Dunlap, Chief Supply Chain Officer for Legacy Investing.
Together, these findings highlight how the next phase of competitiveness won’t be measured only by headcount — but by how ready that workforce is for tomorrow’s jobs.
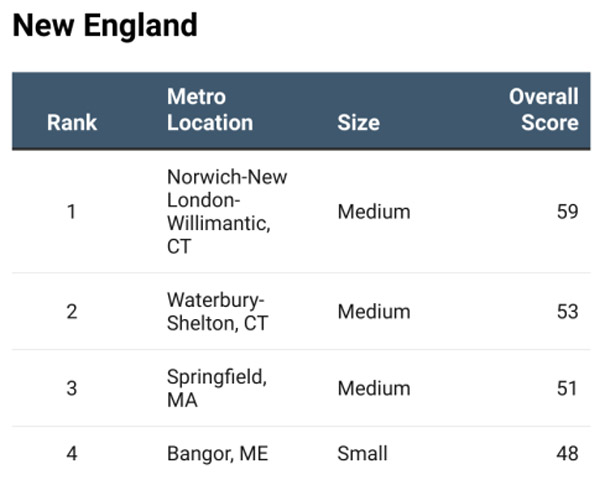
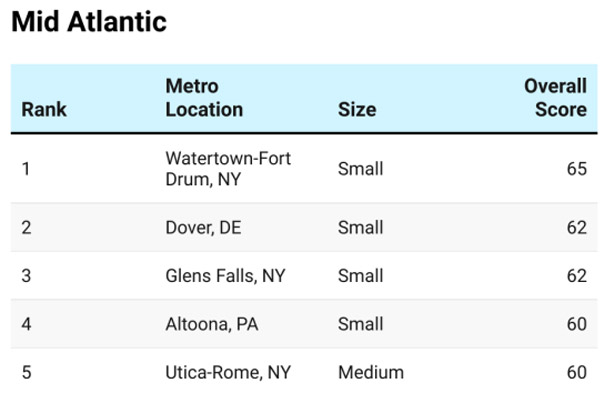
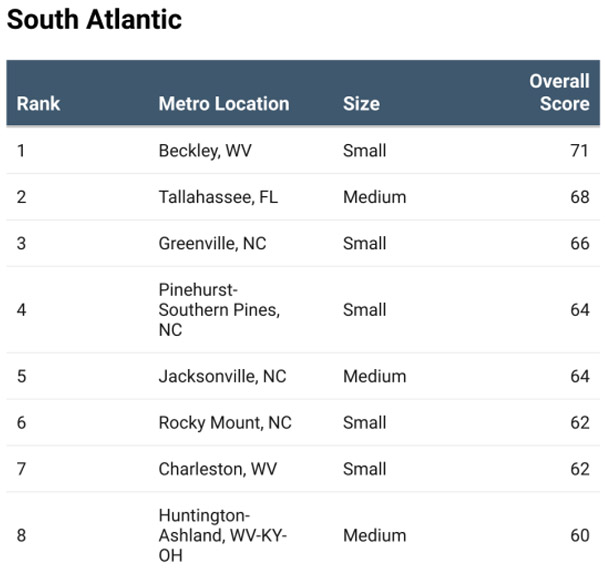
2025’s Leading Locations

Workforce Strength: Where Jobs Meet Momentum
If the Prime Workforce category captures the quality of labor, Workforce Strength reflects how that talent translates into sustained growth. This measure draws from job creation, unemployment trends, and output from advanced industries — indicators that reveal whether a region’s economy is keeping pace with its people.The 2025 data show that large and mid-sized metros are driving this year’s gains in economic performance, particularly across the Southwest and Mountain divisions.
Las Vegas–Henderson–North Las Vegas, NV; Indianapolis–Carmel–Greenwood, IN; and Laredo, TX stand out among the top performers for Economic Strength — combining workforce expansion with rising wages and diverse industrial portfolios.
These regions balance strong fundamentals with agility. Las Vegas has leveraged diversification beyond tourism; Indianapolis has deepened its advanced manufacturing and logistics base; and Laredo continues to capitalize on its role as a critical node in North American supply chains.
“Smaller regions like Laramie, Vernal, and LaGrange are showing that workforce readiness is less about scale and more about alignment. They’re aligning education, economic development, and industry around targeted skills—especially in automation and advanced manufacturing—which makes them far more adaptive to change. Larger markets can learn from this by prioritizing focused talent pipelines over broad labor pools and by building ecosystems where employers, educators, and community leaders co-invest in future-ready skills” Dunlap said.
Together, the Prime Workforce and Workforce Strength rankings tell a single story: competitiveness now hinges on how quickly communities can translate skills into sustained economic impact.
Major Metros: Scale Meets Saturation
America’s biggest metros remain economic anchors — but their performance is flattening. When population and infrastructure reach a certain threshold, growth changes character.
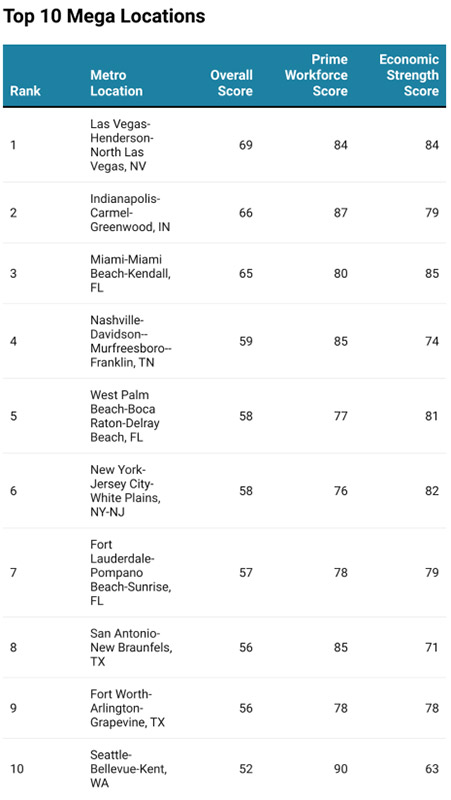
Las Vegas–Henderson–North Las Vegas leads the group with a total score of 68.6, powered by diversification into logistics, clean energy, and advanced manufacturing. Indianapolis–Carmel–Greenwood, IN follows closely, benefiting from its balanced cost structure and deep industrial supply chain.
In the South Atlantic, Miami–Miami Beach–Kendall, FL continues to rise as a regional financial and logistics hub, while West Palm Beach–Boca Raton–Delray Beach, FL reflects Florida’s overall momentum in post-pandemic relocations.
Meanwhile, New York–Jersey City–White Plains, NY–NJ; Houston–The Woodlands, TX; and Los Angeles–Long Beach–Glendale, CA remain global powerhouses — but their competitiveness now depends more on efficiency and talent quality than on raw scale.
“Large metros are still where the capital is,” says Chmura, “but they’ve reached a point of equilibrium. Their next gains will come from improving efficiency, innovation, and livability — not just expansion.”
“The data you sent seems to confirm our experience that companies are: one, value-investing — meaning that they are trying to identify the next Austin or Columbus; and two, looking further afield to try to identify communities with unique attributes for their particular project, e.g., power or skill set. With so much data publicly available, site selectors can create algorithms, cast a broader net, and efficiently analyze the data haul,” said Greg Burkart, Principal, Site Selection Services at Walbridge.
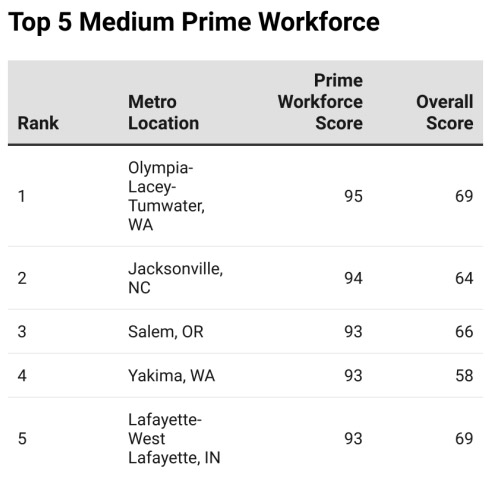
Medium Markets: The Expanding Middle
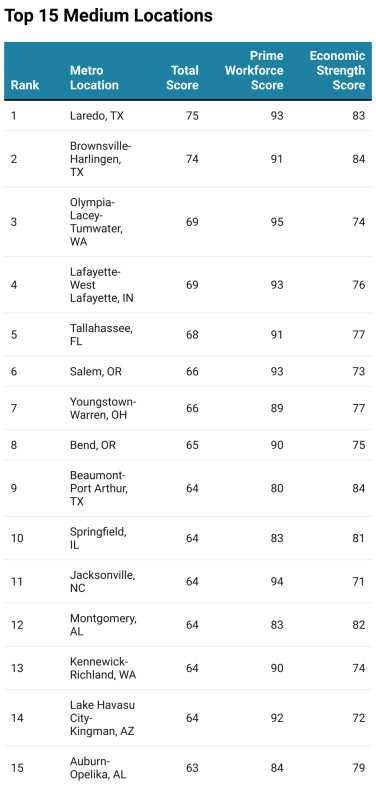
The combined Medium and Medium-Large category highlights a diverse set of metros that have emerged as the new middle class of U.S. competitiveness — large enough to support industry diversity, yet agile enough to adapt quickly.
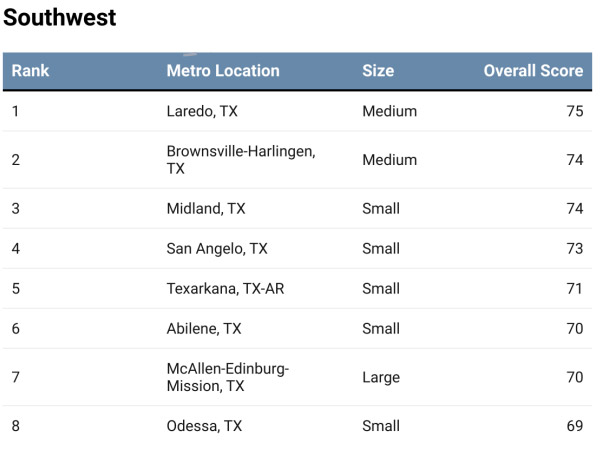
Laredo, TX tops this class with a total score of 75.3, followed by Brownsville–Harlingen, TX and McAllen–Edinburg–Mission, TX, each thriving as critical links in the North American logistics chain. These border metros are capitalizing on nearshoring trends and U.S.–Mexico trade corridors, with strong infrastructure investments reinforcing their rise.
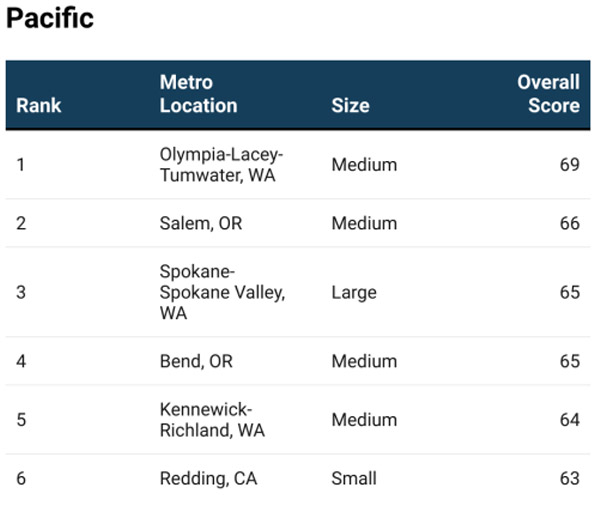
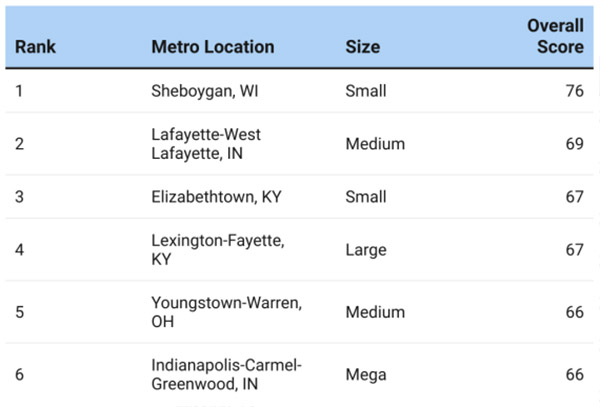
In the Mountain West, Salt Lake City–Murray, UT and Reno, NV combine affordability and workforce participation to attract tech and clean-energy investments. Olympia–Lacey–Tumwater, WA demonstrates the Pacific Northwest’s unique blend of government stability and innovation capacity, while Lafayette–West Lafayette, IN leverages Purdue University’s research base to sustain high workforce alignment and productivity.
“Middle-market metros are where scale and specialization meet,” says Chmura. “They’re big enough to build sophisticated economies but small enough to pivot — and they’re finding their stride where larger metros are constrained by costs.”
“Smaller and mid-sized communities are gaining momentum in industrial development thanks to lower operating costs, efficient permitting, and available infrastructure,” said Courtney Dunbar, Director of Site Selection at Burns & McDonnell. “They’re finding success with right-sized projects that bring sustainable jobs and investment without overwhelming local systems. The key is smart growth — planning infrastructure upgrades, preparing future sites, and aligning industry attraction with the community’s long-term capacity and character.”
Small Markets: Workforce-Driven Success
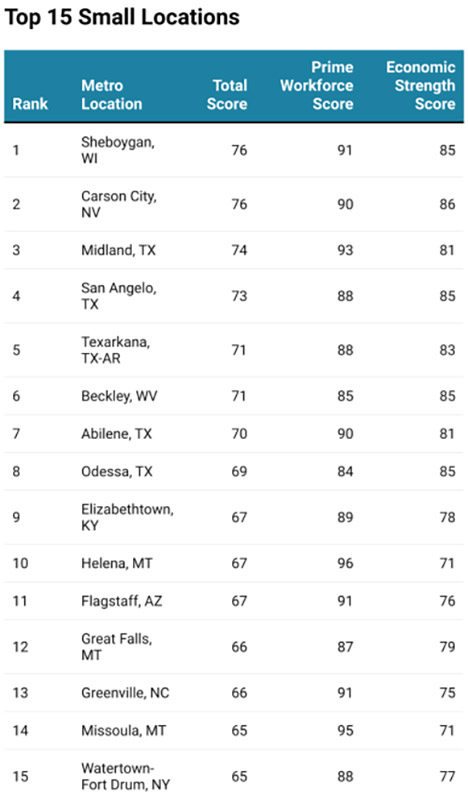
Among smaller metros — typically between 50,000 and 150,000 people — workforce quality remains the defining differentiator. These regions thrive where local partnerships between employers, educators, and governments have created customized talent pipelines.
Hobbs, NM, this year’s top small market, illustrates that dynamic. Its energy legacy is evolving into a diversified economy supported by renewable energy and advanced manufacturing investments. LaGrange, GA is similarly leveraging its location along the I-85 corridor to grow its manufacturing and logistics base, while Sheboygan, WI continues to excel through a combination of skilled-trades education and industrial retention.
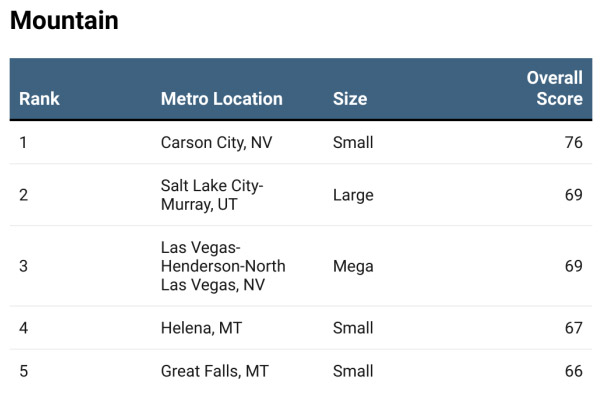
Carson City, NV, supported by state government and spillover from the Reno–Tahoe corridor, reflects how policy stability can underpin economic growth. Meanwhile, Roswell, NM is cultivating a new identity around regional logistics and light manufacturing, distancing itself from its cyclical energy past.
“Smaller metros are closing the gap by pairing lower costs and faster development timelines with targeted infrastructure and workforce investments,” said Gregg Healy, executive vice president and head of Savills Industrial Services. “As companies seek both affordability and efficiency, these markets’ ability to offer accessible labor, multimodal connectivity, and a strong quality of life has become a powerful equalizer.”
Regional Dynamics: Southwest and Mountain Strength
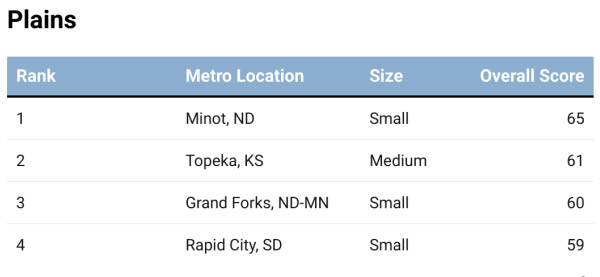
The Southwest and Mountain divisions again anchor the nation’s growth story. Both regions score roughly ten points above the national median in total competitiveness, reflecting broad-based gains in workforce participation, wage growth, and industrial diversification.
Population inflows from California and the Midwest have reinforced their labor supply, while infrastructure upgrades — particularly along the I-10, I-35, and I-40 corridors — continue to support manufacturing, logistics, and clean-energy growth.
“The locations rising to the top are those that have fostered a strong sense of place in their communities and created a sense of belonging. They are also heralding success stories of local industry both externally and internally, to prospect companies and local talent alike. Recent graduates who perceive that strong sense of community are more likely to stay local and outside talent is more willing to relocate if it’s a livable environment whose trajectory is positive,” said Ford Graham, Partnerat McGuireWoods Consulting LLC
What to Watch in 2026
The next edition of the rankings is already taking shape, and early signals from Chmura’s labor, industry, and demographic models point toward a reshuffling of competitive advantages in 2026. One of the strongest predictors will be the continued interplay between housing affordability and the migration patterns of younger workers. Regions that pair job growth with attainable housing — not just market-rate apartments but starter homes, infill redevelopment, and mixed-income planning — are proving dramatically more resilient. The 2025 dataset shows that smaller metros willing to intervene early, such as Vernal, Utah, are capturing workforce share at a pace that outstrips peers three to five times their size. Expect more communities to follow this approach, and expect the gap to widen between places that treat housing as economic infrastructure and those that approach it as a standalone policy silo.
Infrastructure resilience will also carry more weight as site selectors bake longer planning cycles into their models. This means more scrutiny on multimodal freight corridors, last-mile congestion, and the reliability of regional water and power systems. Broadband quality — once treated as a baseline requirement — is becoming a differentiator again as manufacturers and logistics operators depend more heavily on real-time data, digital twins, and remote-operations capabilities. Regions that can show consistent uptime, strong redundancy, and clear plans for grid modernization will rise. Those with aging substations, constrained transmission, or fragmented water governance will struggle to keep pace.
Another factor to watch is the adoption curve for workforce-tech tools, particularly the integration of AI-assisted training, simulation labs, and credentialing platforms. Community colleges and workforce agencies are beginning to differentiate themselves not only by the volume of graduates they produce, but by the speed at which they can align curricula with employer needs. Early movers — especially states with statewide talent accelerators or consolidated economic development structures — are likely to see these gains reflected more clearly in 2026. Companies evaluating future locations will increasingly ask not only “How many workers can we hire?” but “How quickly can this region re-skill and up-skill the team we already have?”
Finally, regional cooperation is emerging as an underappreciated force in next year’s rankings. Water-sharing agreements, multi-county energy districts, joint logistics corridors, and cross-border workforce initiatives are beginning to show measurable economic returns. Corporate investors are responding to regions that can present unified permitting, synchronized incentives, or aligned training programs — all indicators that a community can operate at the speed required by modern project timelines. In 2026, this sort of cooperative governance may be one of the strongest predictors of whether a region climbs, holds, or falls in the rankings.
Final Observations
From major metros balancing maturity to small towns mastering agility, the 2025 data reveal an economy diversifying by design. Competitiveness is no longer measured by population or skyline — it’s defined by how well a region aligns its people, policies, and possibilities.
For site selectors and corporate decision-makers, the message is clear: in 2025, advantage isn’t about size — it’s about strategy.
Leading Metro Locations 2025: All 949 metropolitan and micropolitan area scores