Which is it? Does a skills gap exist in manufacturing, or at least is it getting tougher to find manufacturing talent? Two things are certain: (1) The labor market is tightening, which is pushing up wages — even in manufacturing; and (2) job openings far outpace hires in manufacturing. Nonetheless, the best answer to the skills-shortage question is that it depends on where you’re located, the positions you’re looking to fill — and perhaps most importantly, the compensation you’re willing to offer.
How to Spot a Shortage
One of the best ways to spot a potential worker shortage, if you can find reliable data over time, is to analyze historic wage trends. When labor demand outstrips labor supply, wages should go up. “If finding qualified workers is so hard, for example,” Casselman notes, “then companies should be offering higher pay to attract and retain precious workers.”
That’s not the case nationally. Growth in wages among manufacturing workers in nonsupervisory roles has tracked about the same as the same category of workers in all private-sector industries. And industrywide per Emsi, which compiles administrative data from the BLS, growth in earnings was lower in manufacturing (8 percent) than all private-sector industries (10 percent) from 2012 to 2016 before adjusting for inflation. Next time you read or hear a bold proclamation on the truth or fiction of a national skills shortage, think about the complexity of our economy.
Skills gaps, though, are best diagnosed locally or regionally - Emsi. The U.S. economy is composed of hundreds of metro area economies, some of which are similar or larger than the economies of major nations (e.g., the Los Angeles metro’s gross metro product at purchasing power parity almost equals Australia’s GDP). These MSAs, along with micropolitan and rural areas, combine to form an incredibly complex American economy.
Next time you read or hear a bold proclamation on the truth or fiction of a national skills shortage, think about the complexity of our economy. All economics is local, and most skills gaps (if they’re not information, training, or wage gaps disguised as skills gaps) manifest themselves locally.
So, where should manufacturing executives be most concerned about finding talent or most need to consider bumping up wages to compete for workers? Emsi looked at the 2012–2016 change in manufacturing earnings among the most populous 150 metros and in every state. (Note: These earnings are reported industrywide, so they include everyone from entry-level laborers to CEOs. We didn’t include supplements to income like 401(k) contributions.) We then examined wages and unemployment over time for a few key manufacturing occupations, both white-collar and blue-collar positions, to get an indication of the jobs that are challenging to fill.
The Regions Seeing Manufacturing Wage Increases
In the Raleigh MSA, the average manufacturing salary was $88,000 in 2016, up from $66,000 in 2012. That’s an increase of 33 percent before adjusting for inflation — more than 2.5 times faster than wages for all private-sector industries (13 percent) and faster than any large metro area. *
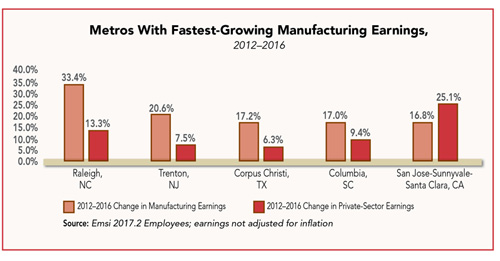
In each of these metros, manufacturing salary growth from 2012 to 2016 outpaced private-sector earnings change. The same was true in Trenton, New Jersey, which ranked No. 2 with a 21 percent wage increase in manufacturing compared to 8 percent in all industries, and Corpus Christi, Texas (No. 3 at 17.2 percent compared to 6 percent for all industries). Manufacturers who are struggling to recruit workers have a few options. They can increase wages. They can consider other, more talent-rich locations. Or they can invest in automation.
On the flip side are tech-focused metros like San Jose, Seattle, and Boston. San Jose ranked fifth in manufacturing wage growth (16.8 percent) and first in total private-sector wage growth (25 percent). The situation is much starker in Seattle, which ranked second in overall wage growth (16 percent) but 72nd in manufacturing wage growth (9 percent). These are high cost-of-living cities with ultra-skilled workforces. Tech manufacturing is an important part of their economies, but manufacturers haven’t kept pace in the salaries they’re offering.
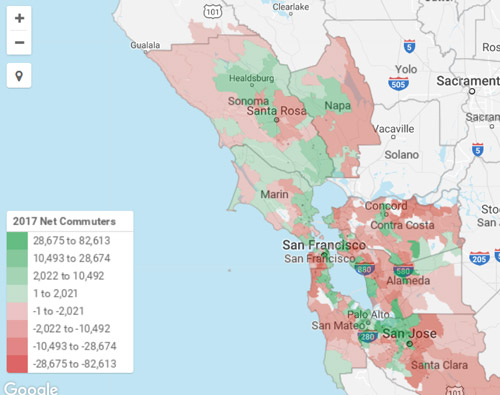
At the state level, Alaska (22 percent), Wyoming (15 percent), and California (12 percent) grew manufacturing wages the most in the last five years. Louisiana and North Dakota (both 11 percent) rounded out the top five, but manufacturing jobs in both states dipped from 2012 to 2016.
Bringing Unemployment Data into the Picture
This data suggests that manufacturers in the aforementioned states and metros will face increasingly robust competition for talent. But wage trends are just one clue in the supply-and-demand picture. Another is unemployment.
In January, Raleigh had an estimated 1,350 unemployed manufacturer workers, according to Emsi, which accounts for 5 percent of the metro’s total unemployed. Nationally, 8 percent of the unemployed have previously worked in manufacturing. In Trenton, there were just 254 unemployed in manufacturing, 4 percent of the regional total. Raleigh was one of several Southeast metros to see healthy manufacturing wage and employment spikes the last five years.
Compare these two metros with San Jose, where 15 percent of the unemployed (over 5,400) were in manufacturing in January. The higher-than-average unemployment in manufacturing indicates that San Jose has excess manufacturing talent. These unemployed workers perhaps can’t find manufacturing jobs that pay the bills or don’t have the advanced skills to meet industry needs.
Which Positions Are Hardest To Fill?
A quarter of America’s 12.3 million manufacturing jobs are staffed in eight occupations, led by team assemblers; supervisors of production workers, inspectors, testers, and sorters; machinists; and hand laborers and freight, stock, and material movers.
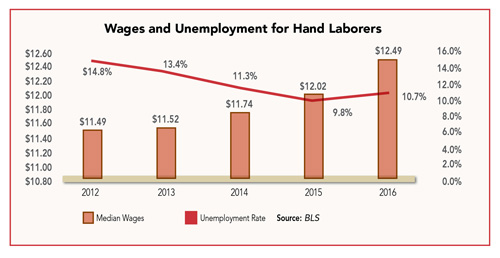
In our work with corporations developing strategic site selection and talent acquisition plans, we often come across companies that struggle to find hand laborers. This is also reflected in Manpower’s 2016 talent shortage survey. Laborers, after being absent in 2015, ranked higher than engineers and technicians in the top 10 hard-to-fill positions. Nationally, unemployment for hand laborers stood at 10.7 percent in 2016 after sitting at 14.8 percent in 2012 — an improvement but still a high jobless rate, which could be partially due to high turnover.
Another similar occupation that requires slightly more skills is packaging and filling machine operators and tenders. These workers are highly compatible to hand laborers, according to Emsi’s occupational compatibility index, and their wages have risen 9 percent to $13.60 per hour in 2016. Perhaps the most telling indication that the demand is rising for packaging operators? Their unemployment rate has dropped from 14.5 percent in 2012 to 8.2 percent in 2016, per the BLS’s Current Population Survey.
These are both blue-collar factory positions. What about white-collar positions? One of the prime examples is industrial engineers. More than 170,000 of these high-skilled workers are employed in manufacturing (1.4 percent of total industry employment). Their median wages increased 7 percent the last five years and their unemployment rate has remained extremely low; it stood at 2.5 percent in 2016 and 2.7 percent in 2012.
The Bottom Line
Manufacturers who are struggling to recruit workers have a few options. They can increase wages. They can consider other, more talent-rich locations. Or they can invest in automation. Many will likely do a combination of these things. (In most cases, companies need workers with advanced skills to run robots.)
Regardless of the route they take, compensation is clearly on manufacturing executives’ minds. In Area Development’s 2016 Corporate Survey, labor costs catapulted to the third-most important site location factor after ranking No. 6 the previous year. Highway accessibility and labor availability, the No. 1 and 2 factors cited in the survey, have long been concerns, but rising wages are becoming more of a factor in business decisions. This is good news for workers and the economy, and a new reality for businesses.
* Raleigh’s manufacturing growth should be weighed against Durham-Chapel Hill’s decline. Among the 150 largest MSAs, Durham-Chapel had the biggest decrease in manufacturing wages, at -6.2 percent. Factory jobs also declined -13 percent there. This could be an artifact of businesses moving between the two twin MSAs (which used to be one joint MSA).