
For manufacturers evaluating new facilities or expansions, workforce questions are no longer a late-stage concern. They arrive early, shape shortlists quickly, and increasingly determine whether projects move forward at all.
In a labor market defined by demographic pressure, reshoring activity, and accelerating infrastructure investment, manufacturers are learning that legacy signals — such as where jobs already exist — are no longer enough. The more relevant question today is forward-looking: Which states are actively producing the industrial workforce manufacturers will need, and how well does that supply align with real demand?
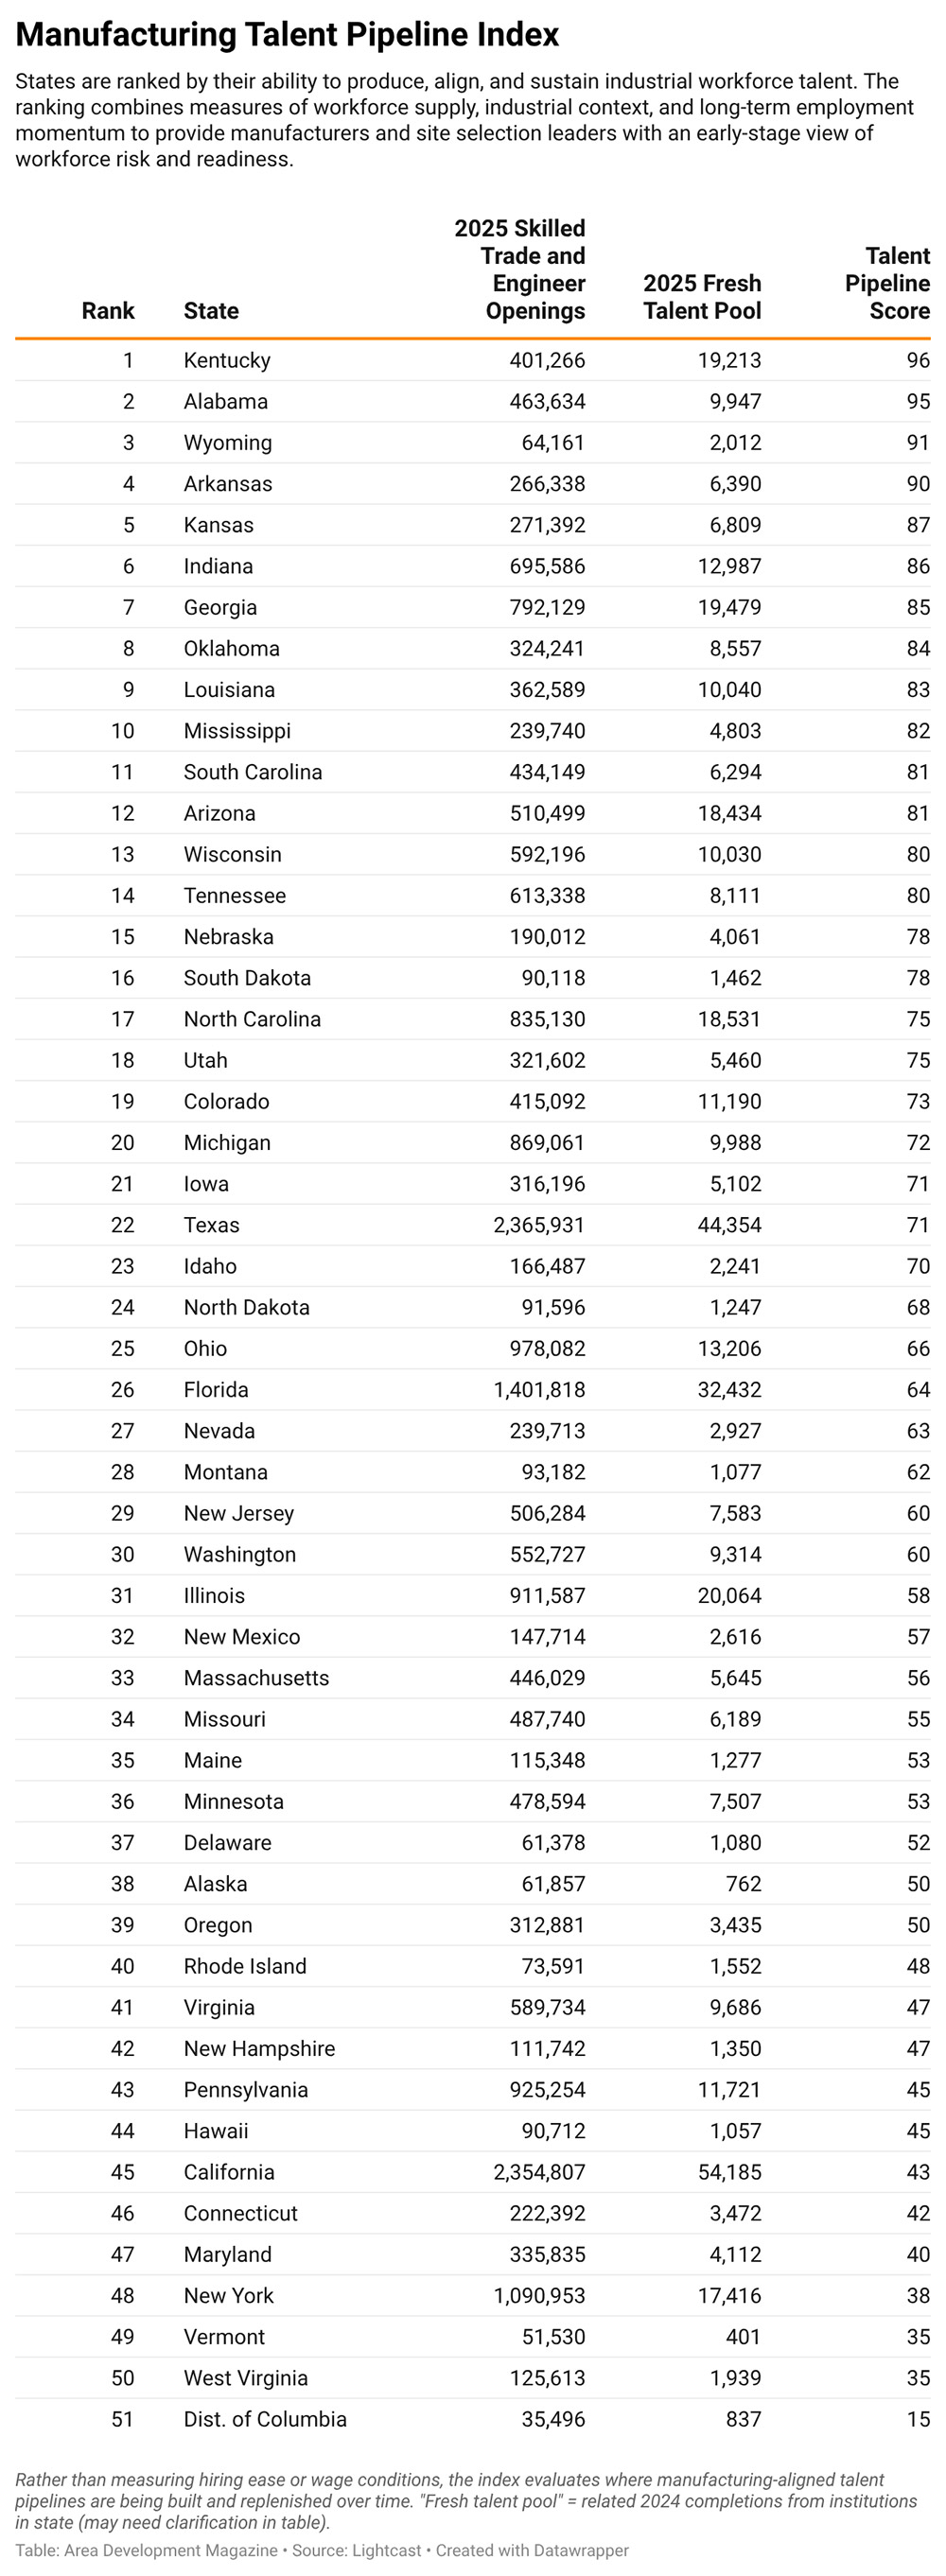
To answer that question, Area Development, in partnership with Lightcast, developed the Manufacturing Talent Pipeline Index, a new state-level ranking that evaluates where manufacturing-aligned workforce pipelines are being built, sustained, and positioned to support long-term investment.
Why Pipeline Capacity Now Matters More Than Ever
For years, site selection decisions leaned heavily on existing labor markets. That approach worked when manufacturing growth was incremental and workforce mobility was relatively stable. Today, it is increasingly unreliable.
Across the country, manufacturers report persistent difficulty hiring skilled trades, engineering technicians, and industrial support roles — even in states with large manufacturing footprints. In many cases, the issue is not a lack of jobs, but a lack of new supply entering the workforce in the right occupations.
“In this era of demographic and AI disruption, labor market alignment is essential,” said Josh Wright, EVP of Growth at Lightcast. “The states best poised to lead the new industrial economy are the ones that are producing a fresh supply of potential skilled trades and engineering technology workers.”
That emphasis on production — not just employment — sits at the center of the Manufacturing Talent Pipeline Index.
What the Index Measures — and Why
The index evaluates states across three dimensions: pipeline output, industrial and occupational context, and long-term employment momentum. Each component is weighted to reflect how manufacturers experience workforce conditions in practice.
The largest share of the score is driven by pipeline output — specifically, the annual volume and concentration of postsecondary completions aligned to manufacturing, skilled trades, logistics, construction, and engineering technician roles. These “fresh talent” measures capture new entrants into the workforce, not the existing labor stock.
This distinction is critical. A state may have tens of thousands of industrial workers today and still face acute hiring challenges tomorrow if training systems are not replenishing supply.
Industrial and occupational specialization provide context. States with dense manufacturing and technical employment benefit from embedded expertise, supervisory depth, and institutional knowledge. These factors matter — but they do not guarantee future availability.
Finally, the index incorporates ten-year employment growth across industrial sectors, skilled technical roles, and total employment. Sustained growth can signal alignment between employers and training systems, while rapid growth can also point to tightening labor markets and rising competition for workers.
Together, these components offer a balanced view of where industrial talent is being produced and how it interacts with real-world labor markets.
Fresh Talent vs. Existing Jobs
One of the most common points of confusion in workforce discussions is the difference between workforce scale and workforce flow.
The Manufacturing Talent Pipeline Index deliberately separates the two.
Fresh talent measures reflect annual in-state completions from postsecondary and technical institutions — the new supply entering the labor market each year. Job counts, by contrast, provide context about the size and maturity of a state’s existing industrial workforce.
For manufacturers, this separation matters. Large job bases do not automatically translate into available workers, particularly in fast-growing markets. Conversely, smaller states may produce meaningful volumes of aligned talent relative to their size, even if their overall employment base is modest.
Exporter States vs. Absorber States
The index also surfaces an important structural distinction: the difference between states that produce industrial talent and those that absorb it.
Wyoming offers a clear example.
On a pipeline basis, Wyoming performs well. Its training systems produce a steady stream of skilled trades and engineering technology graduates relative to the state’s size, reflecting focused, industry-aligned programs. In 2024, however, Wyoming produced roughly 2,100 completions aligned to skilled trades and engineering tech roles, while employers posted more than 6,300 new and replacement job openings in those occupations.
At first glance, that imbalance suggests local demand. But over the past decade, skilled trades and engineering tech employment in Wyoming has declined by about 2 percent. Outside of replacement hiring driven by retirements, the state has not experienced sustained growth in these roles.
The result is a familiar pattern: Wyoming trains industrial talent, but a significant share of that workforce ultimately leaves the state.
Of nearly 8,000 skilled trades and engineering tech workers who attended a Wyoming institution, only about 26 percent currently list Wyoming as their place of employment. In states such as Idaho, Kentucky, and Utah, closer to half of similarly trained workers remain in-state.
This does not reflect a failure of Wyoming’s training system. It reflects the reality of a smaller, more dispersed industrial ecosystem that cannot consistently absorb all the talent it produces.
The index is intentionally designed to preserve this distinction. It rewards states for building aligned workforce pipelines, while still accounting for industrial density and long-term employment trends that shape where talent ultimately works.
What the Top States Have in Common
The highest-ranking states in the Manufacturing Talent Pipeline Index do not follow a single workforce model. Instead, they share a commitment to intentional workforce production.
In these states, training systems are tightly aligned to manufacturing demand. Community colleges and technical institutions play a central role. Employers are engaged in shaping curricula. And pipeline capacity is treated as infrastructure — planned, funded, and sustained over time.
Some top-performing states combine strong training output with dense, diversified industrial bases that retain graduates locally. Others act as regional talent engines, feeding broader manufacturing ecosystems that extend beyond state borders.
What unites them is not size or legacy advantage, but alignment.
“States can produce large numbers of graduates and still face hiring challenges if training output is misaligned with occupational demand,” Wright said. “What matters is whether education and training systems are producing talent in the roles manufacturers are actually hiring for — and whether that production is sustained over time.”
Growth as Signal — and Constraint
Long-term employment growth adds another layer of nuance. Sustained growth across manufacturing and skilled technical roles suggests that workforce pipelines and employer demand are moving in step.
At the same time, rapid expansion can strain labor supply. In some of the fastest-growing markets, manufacturers face intensified competition for talent, rising wages, and increased reliance on internal training or regional recruiting strategies.
The index does not attempt to resolve that tension. Instead, it reflects it — offering manufacturers a clearer picture of where workforce capacity exists and where additional diligence is required.
A Forward-Looking Workforce Lens
The Manufacturing Talent Pipeline Index is not a promise of easy hiring. It is a forward-looking assessment of where industrial talent is being produced, aligned, and replenished.
For manufacturers making long-term investment decisions, that distinction matters more than ever.
“The infrastructure buildout is placing a premium on blue-collar and blue-collar tech workers,” Wright said. “While we are seeing a softening of the white-collar job market, the states at the top of this index are in an enviable position: They’re primed to attract more manufacturing investment and help their residents find solid-paying industrial jobs.”
As workforce availability becomes the defining constraint on industrial growth, states that invest in pipeline capacity — not just attraction — are reshaping the site selection landscape.
This index captures that shift, offering manufacturers a clearer signal about where workforce conversations should begin.