
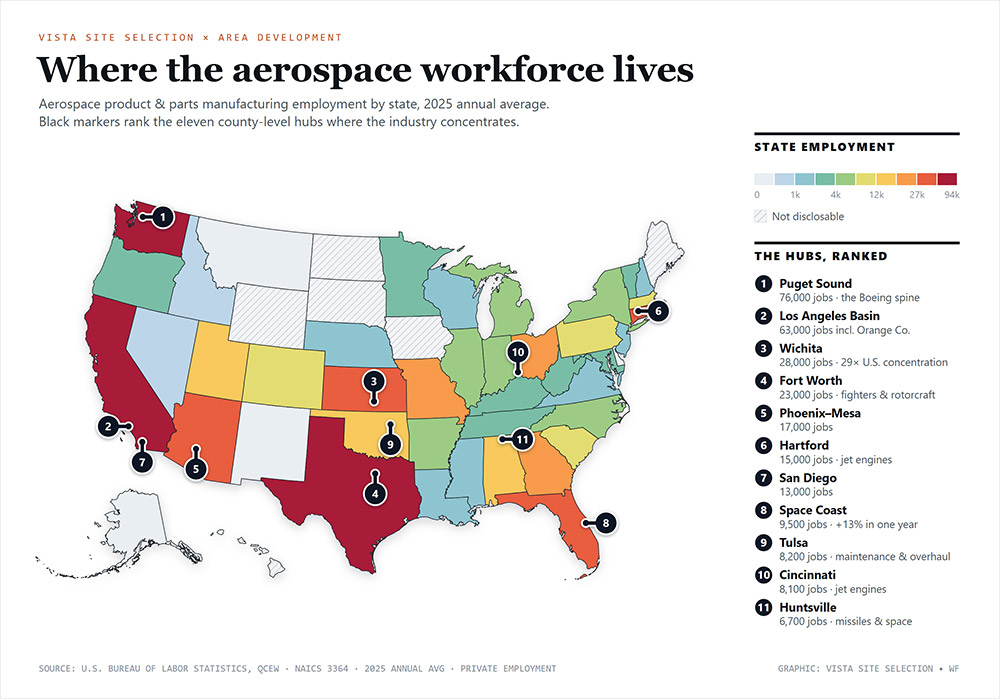
America's quietest boom is hiding in plain sight. With the U.S. defense budget crossing the $1 trillion threshold in fiscal year 2026 — and the administration's fiscal 2027 request pushing total defense resources toward $1.5 trillion — defense aerospace may well be the fastest-growing sector in American manufacturing. Yet unlike past buildups, this one is being shaped as much by where production happens as by what gets produced.
The numbers behind the boom are hard to ignore. In 2025, the aerospace and defense industry surpassed $1 trillion in annual revenue for the first time, with demand outpacing capacity and backlogs at historic highs, according to PwC's 2026 industry outlook. Venture capital has taken notice: Investors poured a record $49 billion into defense technology in 2025 — nearly double the prior year — and the first half of 2026 alone attracted more than $35 billion more, per PitchBook. And the sector's $109 billion trade surplus is the largest of any U.S. manufacturing sector, the Aerospace Industries Association reports. Whatever is happening elsewhere in the economy, within American manufacturing, aerospace and defense is the growth story.
Two forces are converging to make site selection the decisive variable.
First, a wave of well-financed startups is entering the market. As weapons systems production shifts toward platforms that require less capitalization — unmanned systems chief among them — these companies are making the leap from engineering design houses to high-rate production operations and investing in their first large-scale manufacturing facilities to do it. For many, this is the single largest capital decision in company history.
A facility that opens in the wrong labor market doesn't fail on day one. It fails slowly.
Second, heritage contractors are watching closely. The current administration's appetite for “initial production facilitization” funding represents what many see as a one-time window to retrofit — or finally replace — aging plants, some dating to the World War II industrial mobilization. The question these firms face is stark: Pour more capital into an 80-year-old facility in a labor market that has moved on, or use this moment to start fresh somewhere the workforce math actually works?
In practice, that decision turns on four questions. Does the location meet the workforce demand of the operation — both labor availability and labor cost? How does the retrofit cost compare against the alternatives, whether purchase or lease with tenant build-out or ground-up new construction? Which site can actually meet the utility demand? And which site best serves the operation itself — internal operational requirements on one hand and proximity to suppliers and customers on the other? A legacy plant that fails even one of these tests can turn facilitization funding from a windfall into an anchor. Increasingly, it is the workforce and utility questions, not just the real estate math, that decide the outcome — a shift Area Development's own 2026 Corporate Survey confirms, with workforce availability the top-ranked factor in expansion decisions and electric power availability at scale drawing the highest intensity rating of any infrastructure criterion.
The cost of getting it wrong
Making the right site selection decision for an ultramodern production plant is imperative to avoiding what the industry colloquially calls “investing into a slow bleed to extinction.” A facility that opens in the wrong labor market doesn't fail on day one — it fails slowly, through chronic understaffing, wage escalation, missed delivery schedules and quality/scrap issues, until the program it was built to serve is no longer competitive.
The discipline rests on the oldest equation in defense program management — cost, schedule and performance — a balance the Pentagon's current acquisition reforms explicitly preserve even as they elevate speed of delivery to a wartime footing and open the aperture to commercial technology and nontraditional industry partners more widely than at any point in decades. It is sharpened by the quality philosophy W. Edwards Deming brought to modern manufacturing: a predictable degree of uniformity and dependability, at low cost, suited to the market. In defense aerospace, schedule and performance are measured against near-peer threats — and cost determines whether a program survives its next budget cycle.
What has changed is not the standard. It's the toolkit for meeting it.
The new site selection toolkit
A decade ago, an aerospace and defense site search ran on a familiar formula: Shortlist the states with existing defense clusters, compare incentives, tour the certified sites and negotiate. Today, the most sophisticated searches look very different. Eight practices in particular are reshaping how decisions are made.
30 Years
Competitive facility analysis — “blackhatting.” Borrowed from the capture-management world, blackhatting now extends to physical operations: using cellphone mobility data and other open-source analysis of competitors' facilities to reverse-engineer their operating costs, shift structures, commute sheds and labor draw. Before committing to a market, a company can now model — in remarkable detail — what it actually costs a competitor to run a comparable plant and whether a proposed site can beat it.
A plant is not staffed once. It is staffed continuously for 30 years.
Hiring analysis. Rather than relying on published occupational data alone, companies are building accurate hiring profiles for a new plant by analyzing their own comparable facilities alongside competing ones — who those plants actually hire, from where, at what wages, with what attrition. Occupation-code screens establish the baseline; resume-level and job-posting data reveal the behavior underneath it. The result is a staffing model grounded in demonstrated hiring rather than statistical averages.
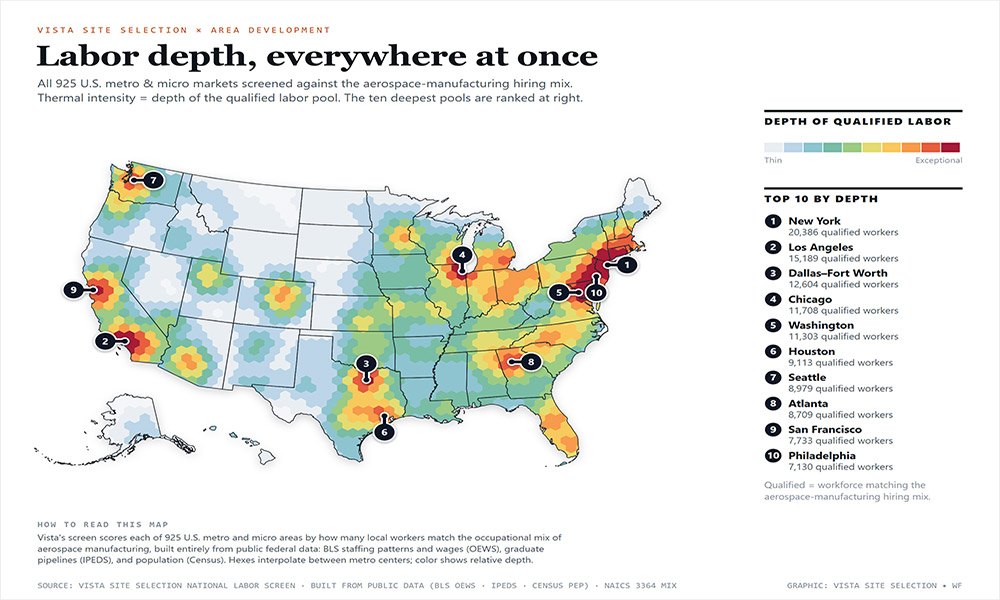
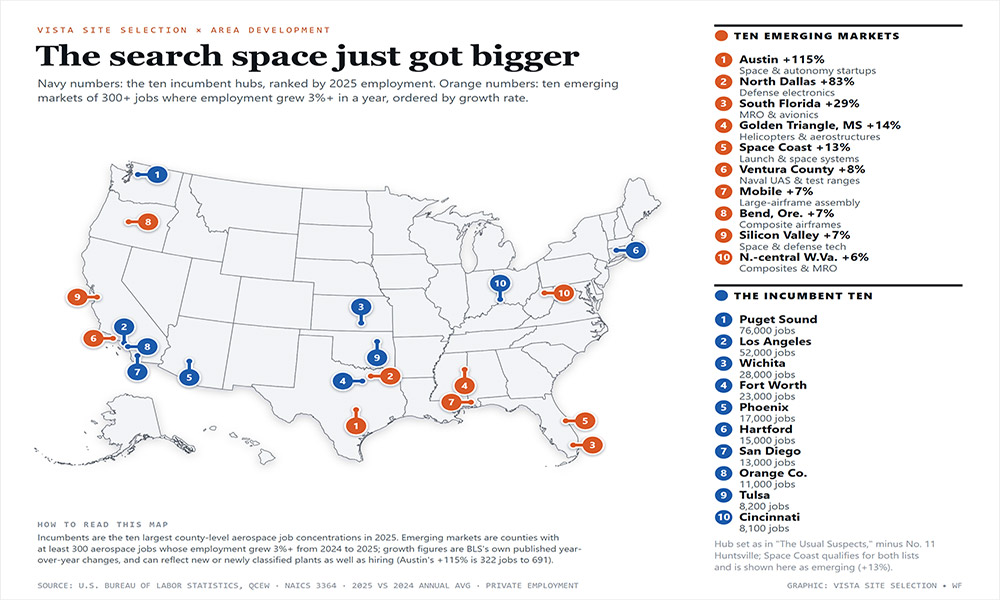
AI-powered labor searching. New AI algorithms allow a company to search the entire country — not a prefiltered shortlist — for enclaves of labor that can fulfill its hiring requirements at five times the depth of need or more. That depth matters: No employer captures an entire labor pool, and a plant hiring against entrenched incumbents needs a deep bench, not a bare match. This is the single biggest departure from legacy practice: The search space is no longer limited to where defense work has historically been done.
Pipelining. A plant is not staffed once; it is staffed continuously for 30 years. AI analysis of projected demographic and economic growth patterns in acceptable regions now lets companies build a long-term pipeline model — accounting for attrition, retirements and program growth — before a shovel hits the ground. The inputs are concrete: technical program completions, demographic cohorts aging into the workforce and — in defense-adjacent markets — the steady outflow of separating military personnel with directly transferable skills.
The search space is no longer limited to places where defense work has historically been done.
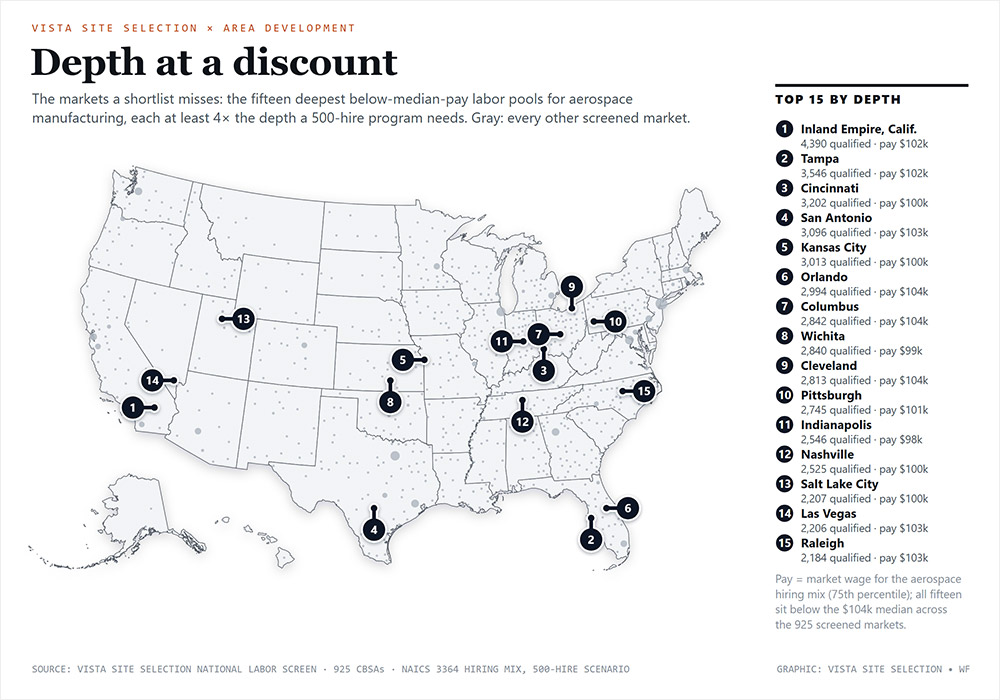
Hidden enclaves. The practical payoff of the above: identification of previously unknown regions that can supply the required labor at a material cost savings versus “the usual list of suspects” — the obvious and increasingly saturated defense labor markets. As multiple new entrants chase the same machinists, avionics technicians and cleared engineers in the same handful of metros, the companies that find the next market rather than the last one gain a durable cost advantage. What makes these enclaves invisible is underemployment: skilled workers absorbed into jobs below their capability — the machinist running a forklift, the avionics tech doing facility maintenance — who never appear in standard occupational counts but surface immediately in laborshed-level analysis. This is not theoretical: Across several recent engagements, the winning site was not on the client's original list at all — it was surfaced by the search itself. The location a company walks in expecting to choose and the location the data ultimately supports are, increasingly, two different places.
Underlying business climate. None of the analytics matter if the region can't close its gaps. Business incentives that create a targeted, business-friendly environment — paired with workforce development incentives that correct specific deficiencies in the regional laborshed — remain key factors in cost-competitive production. The shift here is precision: The strongest communities are no longer offering generic incentive packages but targeted investments (training pipelines, technical college partnerships, child care and housing initiatives) aimed at the exact deficiencies a company's hiring model reveals.
5X
Institutional partnerships. The connective tissue between a company's pipeline model and a community's business climate is institutional: the technical colleges, universities and workforce development boards that turn a region's raw labor potential into a renewable supply. The strongest locations arrive at the table with these relationships already built — technical college programs that can be tuned to a plant's specific occupational profile, workforce boards willing to co-fund customized training and university engineering programs feeding both the production floor and the front office. Increasingly, those same institutions carry a second value: research and development partnerships. For companies bringing new technology into production — autonomous systems, advanced materials, additive manufacturing — proximity to university research centers and applied R&D institutes means shared laboratory capacity, technology transfer pathways and a stream of engineering talent already working on the relevant problems before they're ever hired. A community that can offer both — workforce infrastructure for today's production and research partnerships for tomorrow's technology — is competing on a different plane than one offering incentives alone.
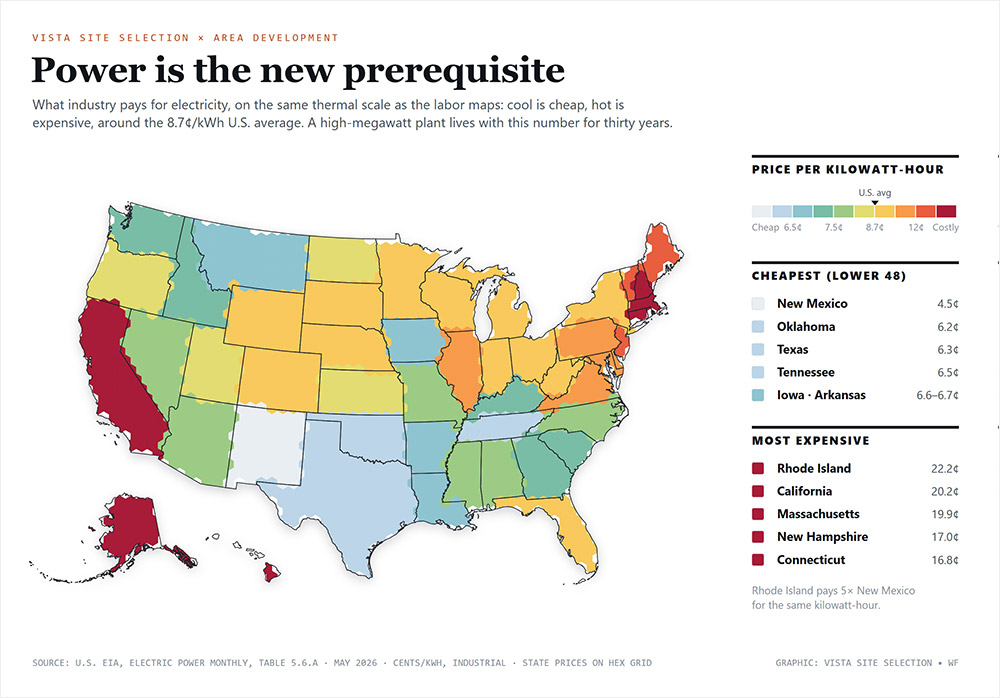
Energy availability and redundancy. Alongside labor, power has quietly become a threshold criterion. Advanced defense manufacturing loads have grown to a scale that many regional grids simply cannot serve on the timelines these projects demand. Recent manufacturing projects are requiring increasingly higher megawatt loads, delivered through two separate feeds from two different substations — each independently capable of carrying the full load. That is not a preference; it is a resiliency requirement. A single-feed site, however attractive its labor market, is a single point of failure for a production line the Department of Defense is counting on. Communities that can document real, deliverable capacity — and utilities willing to commit to redundant infrastructure — hold an advantage.
What it means for companies — and communities
For companies, the implication is that site selection has moved upstream. It is no longer just a real estate exercise conducted after the production decision; it is a labor analytics exercise that increasingly drives the production decision. The startups entering high-rate production and the heritage firms weighing facilitization funding are, in effect, competing in two markets at once: the market for contracts and the market for workers.
The location a company walks in expecting to choose and the location the data ultimately supports are increasingly two different places.
For communities, the prize justifies the rigor. Defense projects should be viewed as long-term strategic investments. They deliver stable, high-wage employment, strong supplier impacts, significant payroll-driven economic activity and sustained community investment — benefits that extend well beyond direct jobs to suppliers, small businesses, housing, retail development, workforce training programs and the tax base itself. Communities that land defense employers often see sustained economic growth, a more resilient workforce and a stronger advanced manufacturing ecosystem that attracts the next project.
For economic development organizations, the message is equally direct. AI-driven screening has put every region in play. But that same transparency works in both directions: Labor depth, wage structures, training capacity and growth trajectories are all visible in the data, and they will speak for a region long before its marketing does. The communities that win this buildup will be the ones that understand their own laborshed as rigorously as the companies analyzing it.
The defense industrial base is being rebuilt in real time. The criteria have evolved. The winners — on both sides of the transaction — will, as Darwin pointed out, not be the strongest or the smartest, but the ones most able to evolve.