Top States
for Doing Business
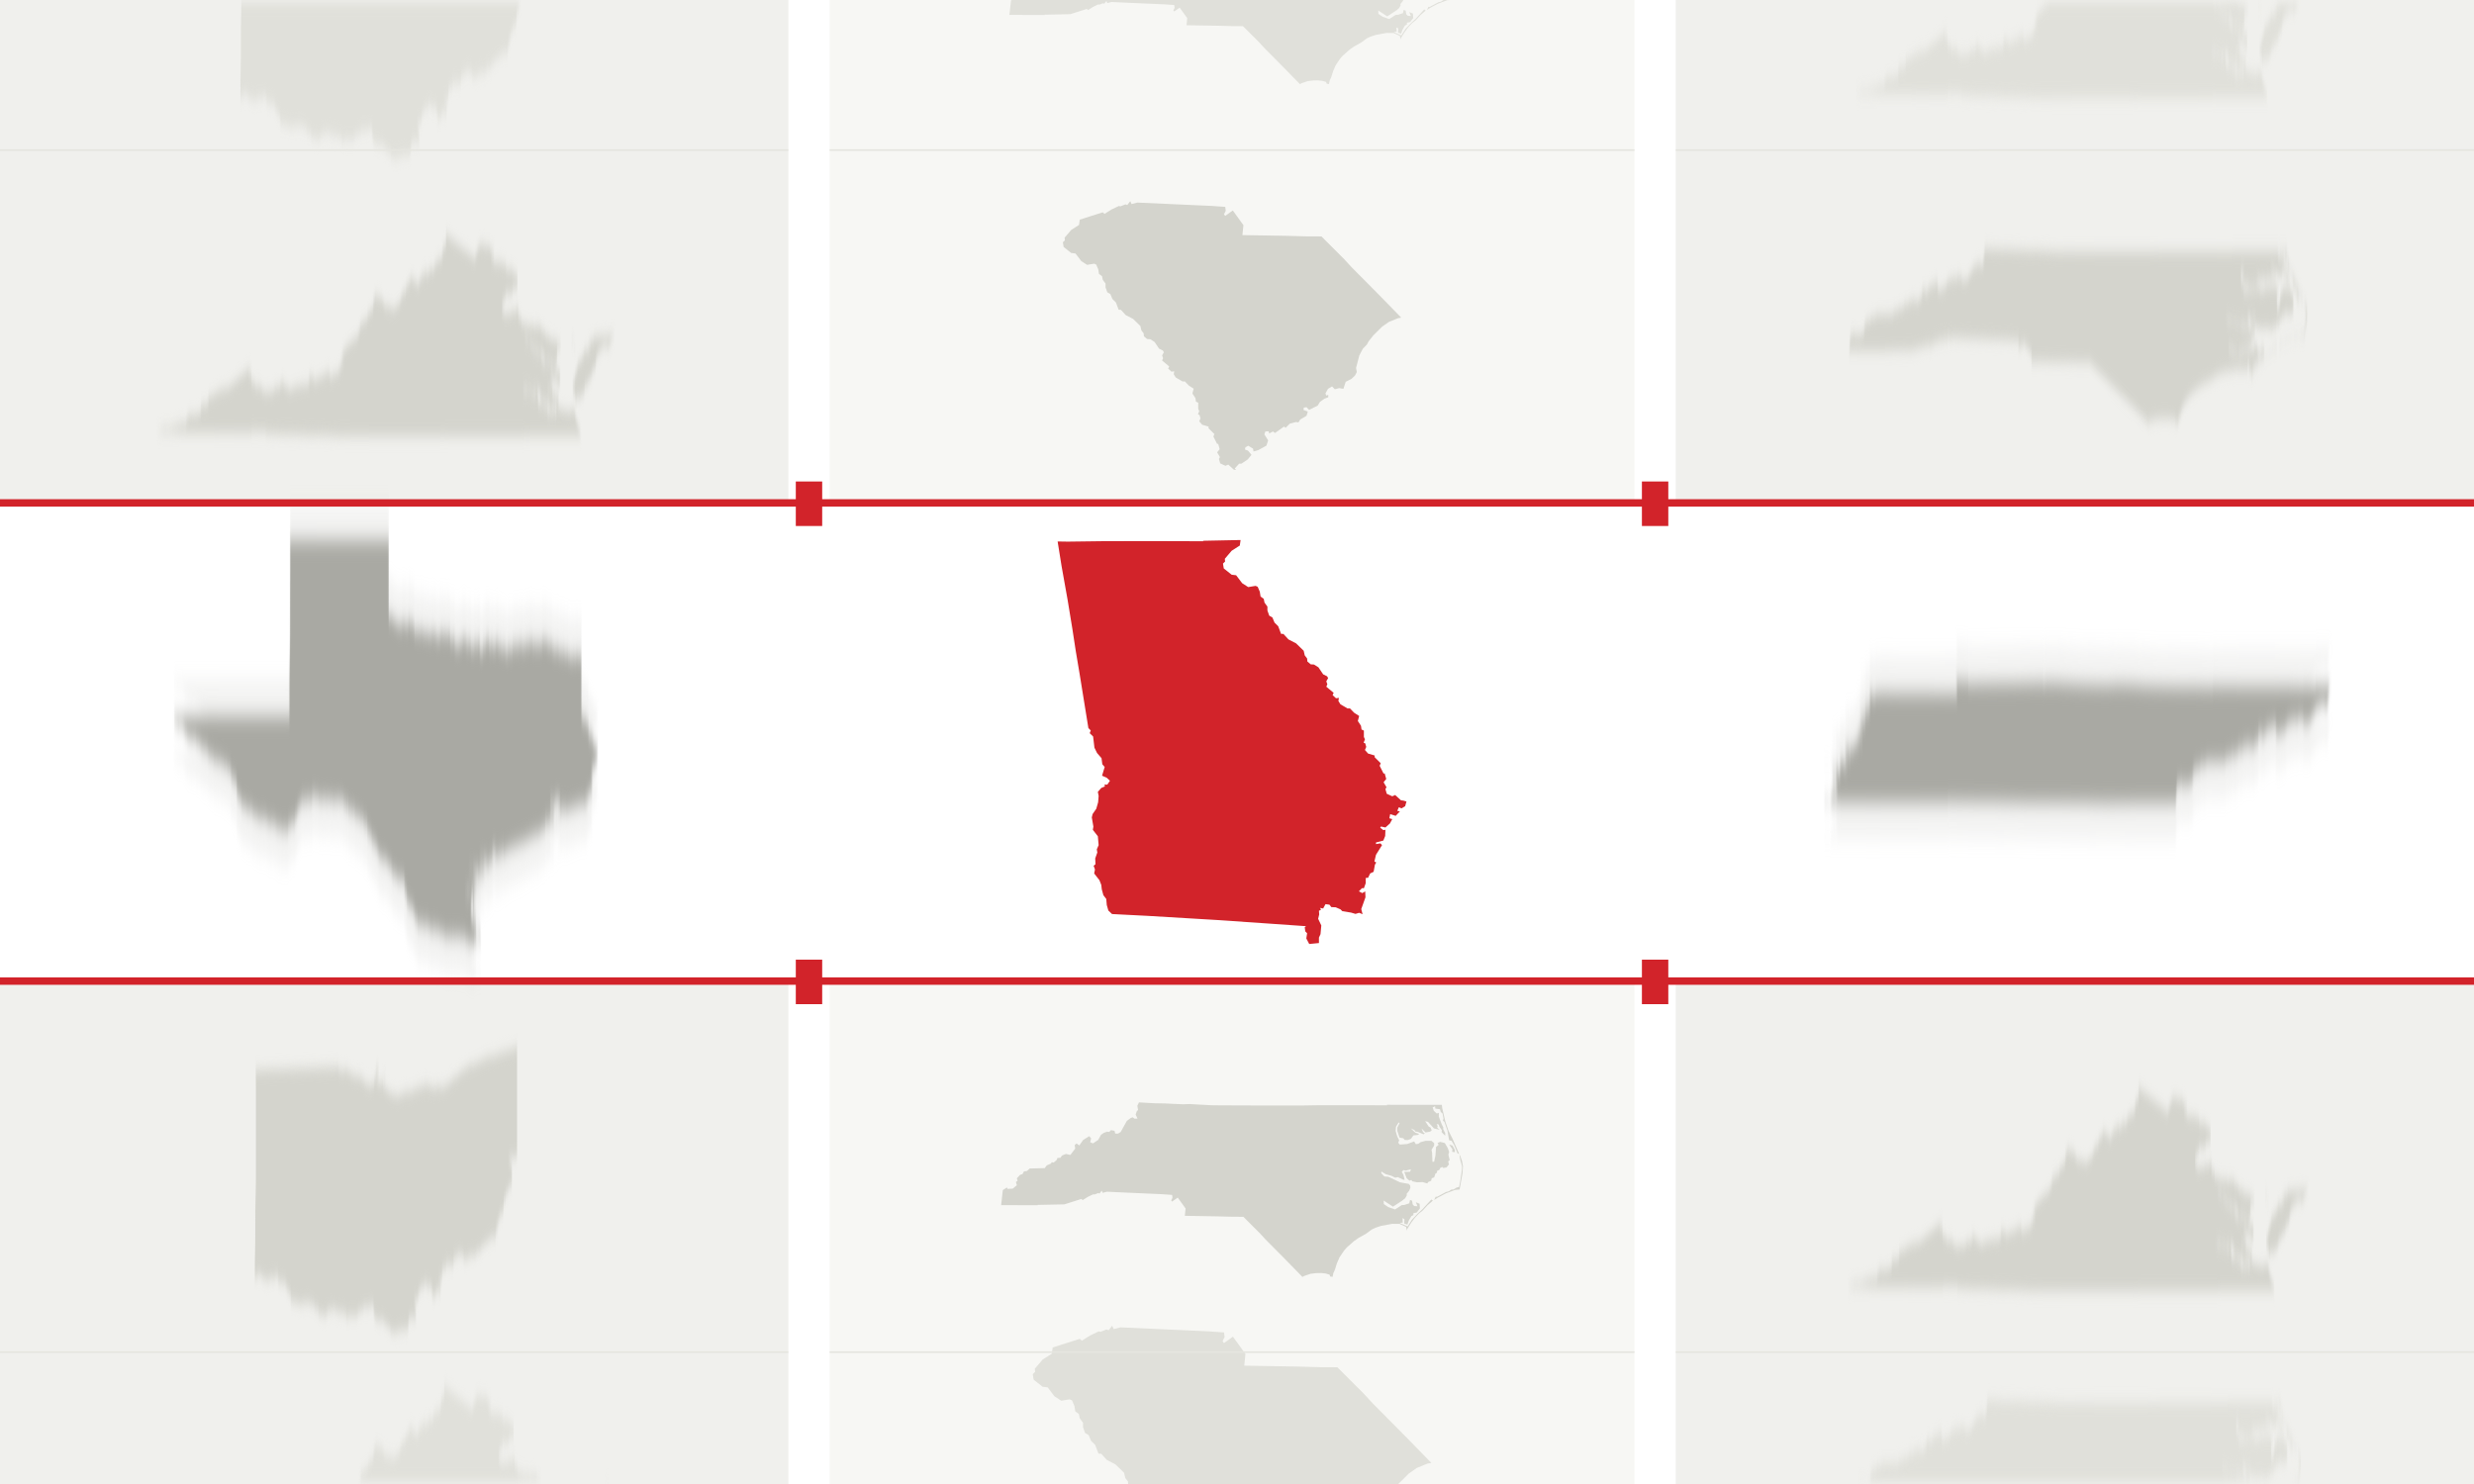
- GEORGIA
- TEXAS
- TENNESSEE
- NORTH CAROLINA
- OHIO
- SOUTH CAROLINA
- ALABAMA
- VIRGINIA
- LOUISIANA
- MICHIGAN
- INDIANA
- MISSISSIPPI
- KENTUCKY
- OKLAHOMA
- ARIZONA
- ARKANSAS
- MISSOURI
- FLORIDA
- PENNSYLVANIA
- ILLINOIS
The states at the top of Area Development’s 2026 ranking do not win on a single measure. They assemble a broad operating proposition: workers who can support increasingly technical production, sites that can move quickly, public partners capable of making decisions and a cost structure that remains competitive after a project is built.
That is why this year’s 20 location factors are best understood in four groups. Workforce, talent and innovation captures both immediate hiring conditions and the deeper systems that replenish skills, engineering capacity and research. Sites, utilities and infrastructure measures whether a state can translate theoretical capacity into a place where a company can actually build and operate. Government responsiveness and project execution examines the machinery around the deal: permitting, incentives, coordination and speed. Cost, tax and long-term operating risk tests whether the initial business case will hold up over time.
The groupings also reveal why the overall leaders separate themselves. Georgia, Texas, Tennessee, North Carolina and Ohio appear repeatedly, but they do so through different combinations of strengths. Some states offer exceptional infrastructure or execution. Others pair deep technical talent with water, power or logistics advantages. Still others remain formidable because they make the economics work.
No category operates alone. A low-cost site loses its advantage if it cannot be energized. A strong labor market cannot rescue an unpredictable permitting process. And an incentive package cannot compensate for years of operating risk. The overall ranking rewards states that reduce friction across the full life of an investment — from the first site search through construction, hiring and long-term production.
01 WORKFORCE, TALENT
AND INNOVATION
- Engineering Talent And Cluster Strength
- Skilled Manufacturing Labor
- Innovation And Research Ecosystem
- Workforce Training
- Labor Cost Competitiveness
02 SITES, UTILITIES AND
INFRASTRUCTURE
- Water and wastewater capacity
- Industrial sites and buildings
- Site readiness
- Energy availability and grid capacity
- Logistics and transportation infrastructure
03 GOVERNMENT RESPONSIVENESS
AND PROJECT EXECUTION
- Responsive state and local government
- Speed to market
- Business incentives
- Permitting predictability
- Regulatory environment
04 COST, TAX AND LONG-TERM
OPERATING RISK
- Overall cost of doing business
- Property tax environment
- Corporate tax structure
- Energy costs
- Climate risk and resilience
Workforce, Talent, and Innovation
No single state dominates the workforce equation. Instead, the rankings reveal several distinct forms of labor-market strength. Texas leads in engineering talent and industry-cluster depth. Georgia ranks first for access to skilled manufacturing labor. North Carolina leads in innovation and research. Virginia tops workforce training, while Alabama holds the leading position in labor-cost competitiveness.
That fragmentation matters because workforce has become shorthand for several different location questions. Can a company hire enough people for launch? Can it recruit engineers and technical managers? Is there a training system able to adapt as processes change? Does the surrounding cluster make specialized skills easier to find? And can the operation carry those labor costs at scale? The strongest states answer more than one of those questions. North Carolina places in the top three for engineering talent, skilled manufacturing labor and innovation. Georgia combines the No. 1 skilled-labor ranking with top-six positions in engineering, training and innovation. Texas leads engineering strength and ranks fourth for both skilled labor and innovation.
Specialized advantages remain visible farther down the table. Michigan ranks second for engineering talent and sixth for skilled manufacturing labor, reflecting the depth of its industrial base. Massachusetts and California rise on engineering and innovation but disappear from the labor-cost leaders. Across the Southeast, Alabama, Mississippi, Arkansas, Kentucky and Tennessee retain a different form of leverage through labor economics.
The table suggests a regional split: Southeastern states dominate labor-cost competitiveness, while Midwestern states retain advantages in engineering and skilled manufacturing depth. Lauren Berry, Director, Location Analysis and Incentives at Maxis Advisors the Midwest’s strength in the breadth of its industrial labor force.
“There are a lot of factors that make the Southeast a better choice, but the Midwest is too often underrated for the depth of engineering and skilled manufacturing workforce,” said Berry. For companies, the implication is not that one model is universally superior. A research-heavy facility, a high-volume assembly plant, and an advanced materials operation will define workforce strength differently. The real question is whether a state can supply today’s employees while continually replenishing the skills an operation will need next.
01 WORKFORCE, TALENT AND INNOVATION
| Rank | Engineering Talent and Industry Cluster Strength | Access to Skilled Manufacturing Labor | Innovation and Research Ecosystem | Workforce Training Programs | Labor Cost Competitiveness |
|---|---|---|---|---|---|
| 1 | Texas | Georgia | North Carolina | Virginia | Alabama |
| 2 | Michigan | North Carolina | Massachusetts | Georgia | Mississippi |
| 3 | North Carolina | Ohio | California | South Carolina | Arkansas |
| 4 | Georgia | Texas | Texas | Louisiana | Kentucky |
| 5 | Ohio | South Carolina | Virginia | Alabama | Tennessee |
| 6 | Virginia | Michigan | Georgia | North Carolina | South Carolina |
| 7 | Indiana | Tennessee | New York | Tennessee | Louisiana |
| 8 | Massachusetts | Alabama | Michigan | Ohio | Oklahoma |
| 9 | California | Indiana | Ohio | Indiana | Texas |
| 10 | Alabama | Pennsylvania | Arizona | Michigan | Georgia |
Sites, Utilities, and Infrastructure
The infrastructure rankings draw a sharp line between states that have assets and states that can deliver them. Texas ranks first for industrial sites and buildings, energy availability and grid capacity, and logistics and transportation infrastructure. Georgia leads site readiness and ranks second in three other measures. Tennessee places in the top three for sites, readiness, energy and logistics.
Those results reflect a changing definition of a marketable site.
Acreage and highway access remain important, but large industrial projects increasingly begin with harder questions: Is power available at the required load and on the required schedule? Is water capacity real or merely planned? Have environmental, geotechnical and utility issues been investigated? Can the site support construction without creating a new critical path?
“Site readiness has really overtaken talent as a priority,” said Monty Turner, Senior Vice President at Colliers. “I’m thinking not only about the availability of sites or buildings, but the infrastructure to support them — including water and wastewater capacity.”
Speed to market, predictability and confidence in getting through the process within a certain timeline are critically important.
Dewey Evans, Vice President at Site Selection Group, said water can be harder to solve than electricity because the constraint is intensely local. “A community may have aging infrastructure with no clear path forward, and the funding can be much harder to piece together for a water-treatment plant,” he said. As capacity is absorbed in faster-growing markets, that can create an opening for parts of the Midwest with access to aquifers, surface water and municipal treatment systems.
Energy presents a different form of uncertainty. Ramya Gowda, Managing Director, Global Consulting and Strategy, Newmark, said power is no longer a question reserved for later diligence. “Even if the requirement is relatively small, we check power availability at the beginning,” she said. “An industrial park may have already allocated that power to another employer. It cannot be taken for granted.”
Site-readiness programs are meant to compress those uncertainties. At their best, they move due diligence forward before a prospect appears and provide evidence about schedule, cost and risk. The broad leaders therefore offer more than infrastructure in isolation: They coordinate the site, utilities, transportation network and development process around a credible path to operation.
That coordination also distinguishes a certified site from a truly executable one.
A designation can document completed studies, but the value lies in whether the utility, community and state can turn that preparation into firm commitments when an actual load, building footprint and operating schedule arrive.
02 SITES, UTILITIES AND INFRASTRUCTURE
| Rank | Water and Wastewater Capacity | Availability of Industrial Sites and Buildings | Site Readiness Programs | Energy Availability and Grid Capacity | Logistics and Transportation Infrastructure |
|---|---|---|---|---|---|
| 1 | Michigan | Texas | Tennessee | Texas | Texas |
| 2 | Ohio | Georgia | South Carolina | Georgia | Georgia |
| 3 | Wisconsin | Tennessee | North Carolina | Tennessee | Tennessee |
| 4 | New York | South Carolina | Ohio | Louisiana | Ohio |
| 5 | Indiana | North Carolina | Georgia | Ohio | Indiana |
| 6 | North Carolina | Ohio | Virginia | Alabama | Illinois |
| 7 | Louisiana | Alabama | Alabama | Oklahoma | Virginia |
| 8 | Illinois | Michigan | Michigan | Indiana | North Carolina |
| 9 | Minnesota | Indiana | Texas | Kentucky | South Carolina |
| 10 | Georgia | Virginia | Kentucky | Arizona | Pennsylvania |
Government Responsiveness and Project Execution
Government responsiveness is sometimes treated as a softer factor than labor, power or logistics. The 2026 results suggest the opposite. For companies managing large capital programs, responsive government is part of the project’s execution infrastructure: It determines how quickly questions are answered, conflicts are surfaced and commitments become operating assets.
Georgia leads both cooperative and responsive government and overall speed to market. It also ranks near the top for incentives, permitting predictability and regulatory environment. South Carolina shows a similarly complete profile, leading permitting predictability and business incentives while placing second in responsiveness and speed. Tennessee and Alabama add depth across the same measures.
This is where the rankings begin to explain Georgia’s 13-year run at No. 1. Its advantage is not simply a collection of favorable inputs. It repeatedly scores well in the functions that connect those inputs: coordination, decision-making, permitting and delivery.
Larry Gigerich, Executive Managing Director at Ginovus, said companies are looking earlier for predictability and confidence that governmental entities will follow through. The best-performing states have systems that move projects efficiently without sacrificing proper review.
As costs have become more similar and workforce markets in the Southeast have been tapped, the pendulum is beginning to swing back toward the Rust Belt.
“Speed to market, predictability and confidence in getting through the process within a certain timeline are critically important,” Gigerich said. “Companies are taking longer to make a final location decision. But once they pick a place and receive their internal approvals, they want to go.”
In practice, that requires more than prompt email replies. Gigerich pointed to regular coordination between economic-development and environmental agencies in Tennessee and South Carolina, realistic permitting schedules and a governor’s office willing to align agencies on strategically important projects.
Sven Gerzer, Principal at Parker Poe Consulting’s Location Solutions team, sees the distinction as early as the RFI. A strong state project manager understands the request, filters local submissions and asks questions instead of simply forwarding material. That preparation becomes even more visible during a client visit.
“Clients pick up quickly on whether things work smoothly in a community,” Gerzer said. “When the state and local teams have worked things out before a project comes in, you can see it. They are prepared, and the process runs smoothly.”
That support can carry particular weight for foreign investors navigating unfamiliar rules and institutions. When many of the underlying economics are equal, Gerzer said, projects often go where the support is strongest.
Responsiveness is also being tested by organized opposition. Berry said anti-growth sentiment that gathered around data centers is beginning to affect unrelated industrial projects, even in traditionally business-friendly markets. That broadens the meaning of business friendliness: Favorable state policies matter only if a project retains a viable path through the local jurisdiction where it will be built.
Speed should not be confused with skipping scrutiny. Predictability is frequently the more valuable outcome. A credible timeline, a clear approval sequence and early disclosure of constraints allow a company to plan. Uncertainty forces it to carry contingencies — or consider another location.
03 GOVERNMENT RESPONSIVENESS AND PROJECT EXECUTION
| Rank | Cooperative and Responsive State and Local Government | Overall Speed to Market | Business Incentives Programs | Permitting and Development Predictability | Regulatory Environment |
|---|---|---|---|---|---|
| 1 | Georgia | Georgia | South Carolina | South Carolina | Texas |
| 2 | South Carolina | South Carolina | Georgia | Georgia | Georgia |
| 3 | Tennessee | Tennessee | Alabama | Tennessee | South Carolina |
| 4 | North Carolina | North Carolina | Ohio | Alabama | Alabama |
| 5 | Alabama | Texas | Tennessee | Texas | Tennessee |
| 6 | Ohio | Ohio | Mississippi | Indiana | Mississippi |
| 7 | Virginia | Alabama | North Carolina | Ohio | Louisiana |
| 8 | Missouri | Mississippi | Louisiana | North Carolina | Kentucky |
| 9 | Michigan | Louisiana | Virginia | Mississippi | Indiana |
| 10 | Texas | Michigan | Texas | Kentucky | Oklahoma |
Cost, Tax and Long-Term Operating Risk
Cost leadership is more fragmented than the other parts of the ranking. Alabama leads both overall cost of doing business and property-tax environment. Texas ranks first for corporate tax structure and energy costs. Michigan leads climate risk and resilience, followed by Ohio. The states appearing consistently across the five measures — including Tennessee, Georgia and North Carolina — do so without necessarily taking the top spot in each column.
That pattern reflects the limits of a single cost number. A project experiences cost through a stack of recurring obligations: payroll, property tax, corporate tax, energy, transportation and the expense of managing physical or regulatory risk. The mix changes by operation. Property-intensive manufacturing may be highly sensitive to local assessments, while an energy-intensive plant can see utility economics overwhelm modest differences elsewhere.
Robby Burgan, Senior Manager, State and Local Tax at Crowe Consulting, said the tax structure becomes highly project-specific once analysts account for the type of entity and the way states apportion income. Recurring operating inputs are less abstract.
“What never gets skewed is the cost of doing business,” Burgan said. “If your power costs twice as much in New York as it does in Alabama, that is going to be a significant obstacle because you are comparing power to power. The same is true of water and other utilities. Those operating costs are what companies are looking at.”
No category operates alone. A low-cost site loses its advantage if it cannot be energized.
Alabama’s position illustrates the power of a broadly competitive operating profile. It ranks first for overall cost and property taxes and remains among the leaders on energy. Texas pairs its tax structure with the No. 1 energy-cost ranking. Tennessee places near the top for overall cost, property taxes and corporate taxes. Those combinations can support a business case long after an initial incentive period ends.
Climate resilience complicates the traditional cost map. Michigan, Ohio, Indiana, Wisconsin and Georgia lead that measure, introducing a different mix of states into the conversation. For projects with long-lived assets, access to water, exposure to extreme weather, insurance availability and the cost of hardening facilities increasingly belong in the financial model. A location with a low opening cost may not remain the lowest-risk option over 20 or 30 years.
The same long view applies to incentives. South Carolina leads that category, followed by Georgia, Alabama, Ohio and Tennessee. Burgan said South Carolina is especially effective at setting the table: Companies can see the available tools, understand what the state is prepared to do and receive a collective package. But an award has value only if it can be documented, approved and realized on the company’s schedule.
That has become more difficult as states adjust programs to new industries and public concerns. Incentive requirements for data centers, for example, are increasingly tied to power, wages and community benefits. Manufacturers are also complicating traditional job-based programs as automation allows companies to make major equipment investments without adding large headcount.
The rankings do not suggest that companies should trade immediate economics for distant hypotheticals. They do suggest that low cost and low risk are not synonyms. The strongest analysis tests several futures: changes in load, wages, tax treatment, insurance, resource availability and the physical conditions surrounding the site. Incentives can improve the opening economics, but labor, utilities, taxes and operating exposure remain after an award expires.
04 COST, TAX AND LONG-TERM OPERATING RISK
| Rank | Overall Cost of Doing Business | Property Tax Environment | Corporate Tax Structure | Energy Costs | Climate Risks and Resilience |
|---|---|---|---|---|---|
| 1 | Alabama | Alabama | Texas | Texas | Michigan |
| 2 | Texas | Tennessee | North Carolina | Louisiana | Ohio |
| 3 | South Carolina | Indiana | Wyoming | Tennessee | Indiana |
| 4 | Indiana | South Carolina | South Dakota | Oklahoma | Wisconsin |
| 5 | Tennessee | Ohio | Tennessee | Georgia | Georgia |
| 6 | Georgia | North Carolina | Florida | Kentucky | Tennessee |
| 7 | Mississippi | Louisiana | Nevada | South Carolina | Iowa |
| 8 | Ohio | Virginia | Ohio | Alabama | Illinois |
| 9 | North Carolina | Arkansas | South Carolina | Mississippi | North Carolina |
| 10 | Kentucky | Arizona | Indiana | Arkansas | Kentucky |
State rankings provide a useful map of competitiveness, but projects do not ultimately land in states. They land on individual sites, inside particular utility territories, labor sheds and local jurisdictions. That distinction has become more consequential as the resources supporting industrial development grow tighter and project schedules become less forgiving.
A state may rank highly for power availability even when the necessary capacity cannot reach a particular site on the company’s timeline. A strong statewide workforce can look very different within a 45-minute commute of the proposed facility. Permitting expectations set at the state level can also collide with a local approval process or organized opposition.
That does not diminish the importance of the rankings. It explains why breadth matters. The strongest states are not simply collecting favorable assets; they are creating systems capable of translating those assets into project-level certainty.
Site readiness offers the clearest example. The term can describe everything from a property that has completed preliminary studies to one with graded land, infrastructure in place and utilities capable of serving a defined load. Those are very different propositions to a company working backward from an operating deadline.
Gerzer said clients increasingly distinguish between sites that exist on paper and those where construction can actually begin.
Site readiness has really overtaken talent as a priority.
“We get a lot of concepts when we do an RFI, not actual sites,” Gerzer said. “Clients prefer seeing a clear, pre-graded site with everything in place rather than a hilly forest and being told, ‘You could do something here. Just imagine it.’”
Turner sees site readiness as a signal about more than the property itself. Communities willing to investigate sites and commit money to infrastructure often demonstrate the same seriousness when projects reach permitting and execution.
“If a state, region or community is truly driving site readiness, that is a good indication of how ease of doing business flows in that community,” Turner said. “When leadership is fully behind site readiness, typically the ease of permitting and regulation follows as well.”
The opposite can also be revealing. Turner said some places emphasize site readiness in their marketing but provide no meaningful program or public investment behind it, leaving private developers to absorb the work. Once a company discovers that gap, it naturally begins questioning what other promised advantages may prove less substantial under scrutiny.
Utilities create another layer of local variation. Power generation may be abundant across a state or region, but that does not mean capacity is reserved at the industrial park, that a substation can be delivered on time or that transmission upgrades fit the project schedule.
Gowda recalled a project seeking an existing building that initially appeared capable of meeting the company’s requirements. The operation ultimately needed only about 8 megawatts, but the team discovered during diligence that the power was not actually available despite what the property’s marketing materials suggested.
“It was taken for granted in the beginning,” Gowda said. “As they moved into the next steps, they realized the power was not there, even though the brochure told a different story.”
Water can be even more localized. Evans noted that electricity constraints generally have recognizable technical, regulatory and financial solutions, even if those solutions are expensive or time-consuming. Water and wastewater capacity can depend on the condition of one community’s infrastructure and its ability to finance improvements.
“You may have aging infrastructure that has no clear path forward, and the funding can be much harder to piece together for a water-treatment plant,” Evans said.
That helps explain why Michigan, Ohio and Wisconsin stand out in the water rankings while the infrastructure tables otherwise favor Texas and the Southeast. Access to water is only the beginning; communities must also be able to treat it, move it and support the discharge requirements of the proposed operation.
Government execution is where these localized conditions are supposed to converge. Gigerich pointed to Tennessee and South Carolina, where economic development and environmental agencies regularly meet to review active projects. Those communication channels create accountability and allow potential conflicts to surface before they become schedule-threatening surprises.
The best state teams also resist the temptation to promise an unrealistically fast path. Gigerich said companies gain more confidence from a credible timeline that agencies can meet than from an aggressive schedule that later collapses.
What the Rankings Reveal
The 2026 Top States for Doing Business ranking shows several viable paths to competitiveness — and a narrowing tolerance for weak links.
Georgia’s 13th consecutive No. 1 finish is the clearest example of breadth. The state does not lead every measure, but it rarely falls far behind. Its workforce, training, infrastructure, utilities and public agencies function as parts of the same operating proposition. That consistency gives companies confidence that advantages promised during site selection will still be there during permitting, construction and hiring.
The other leading states assemble their own combinations. Texas pairs scale, engineering depth, sites, energy and logistics. Tennessee performs consistently across infrastructure, execution and cost. North Carolina combines workforce and innovation strength with an increasingly mature delivery platform. Ohio’s top-five finish reflects a mix that includes water, engineering talent, skilled labor, energy and incentives.
Below that tier, states distinguish themselves through more concentrated advantages. Michigan’s engineering base, water position and resilience profile remain powerful. South Carolina excels in project execution. Alabama combines competitive labor and operating costs with strong government performance. Virginia leads workforce training and also appears across talent, site readiness and regulatory measures.
The rankings also capture a gradual shift in the industrial map. The Southeast remains the country’s most consistently competitive region, but its success has tightened labor markets and absorbed some of its most readily available sites and infrastructure. At the same time, Midwestern states are converting long-standing industrial assets — engineering talent, water, transportation networks and manufacturing clusters — into a renewed location proposition.
“The Southeast has long been — and still is — where people think first when they want to build a plant,” said Evans. “But as costs have become more similar and workforce markets in the Southeast have been tapped, the pendulum is beginning to swing back toward the Rust Belt.”
That does not mean the advantage is simply moving from one region to another. It means the field is becoming more project-specific. A state that excels for an advanced manufacturing operation may not be the best answer for a water-intensive food plant, a research-driven facility or a project facing an unusually compressed power schedule.
For decision-makers, the rankings are therefore a starting point, not a substitute for project-level diligence. They identify where experienced site consultants repeatedly see strength. The next question is whether that strength exists at the particular site, utility territory, labor shed and jurisdiction under consideration.
The leading states are those most often judged capable of turning a proposal into a functioning operation — and sustaining its business case without introducing a fatal surprise along the way.